3.2. Percentage of each land cover class affected by the flooding
In the previous section, a qualitative inspection of the most affected land cover classes was performed. Here, we move to a quantitative evaluation, which requires several steps. Nevertheless, in QGIS there is the possibility to build a custom model capable of executing a step-wise pipeline which can be used with diverse data without the need of going manually through each step every time. The tool used for this operation is called Model Designer (or Graphical Modeler) (Fig. 3.2.1) . To open it, click on Processing in the toolbar (1), then select Model Designer (2), and a new window will appear (3). Firstly, we must give a name to the model we are going to create: call it “Raster_flooding_analysis” (4) and save it by clicking on the floppy disk icon (5). In order to add an already existing model click on the folder icon (6).
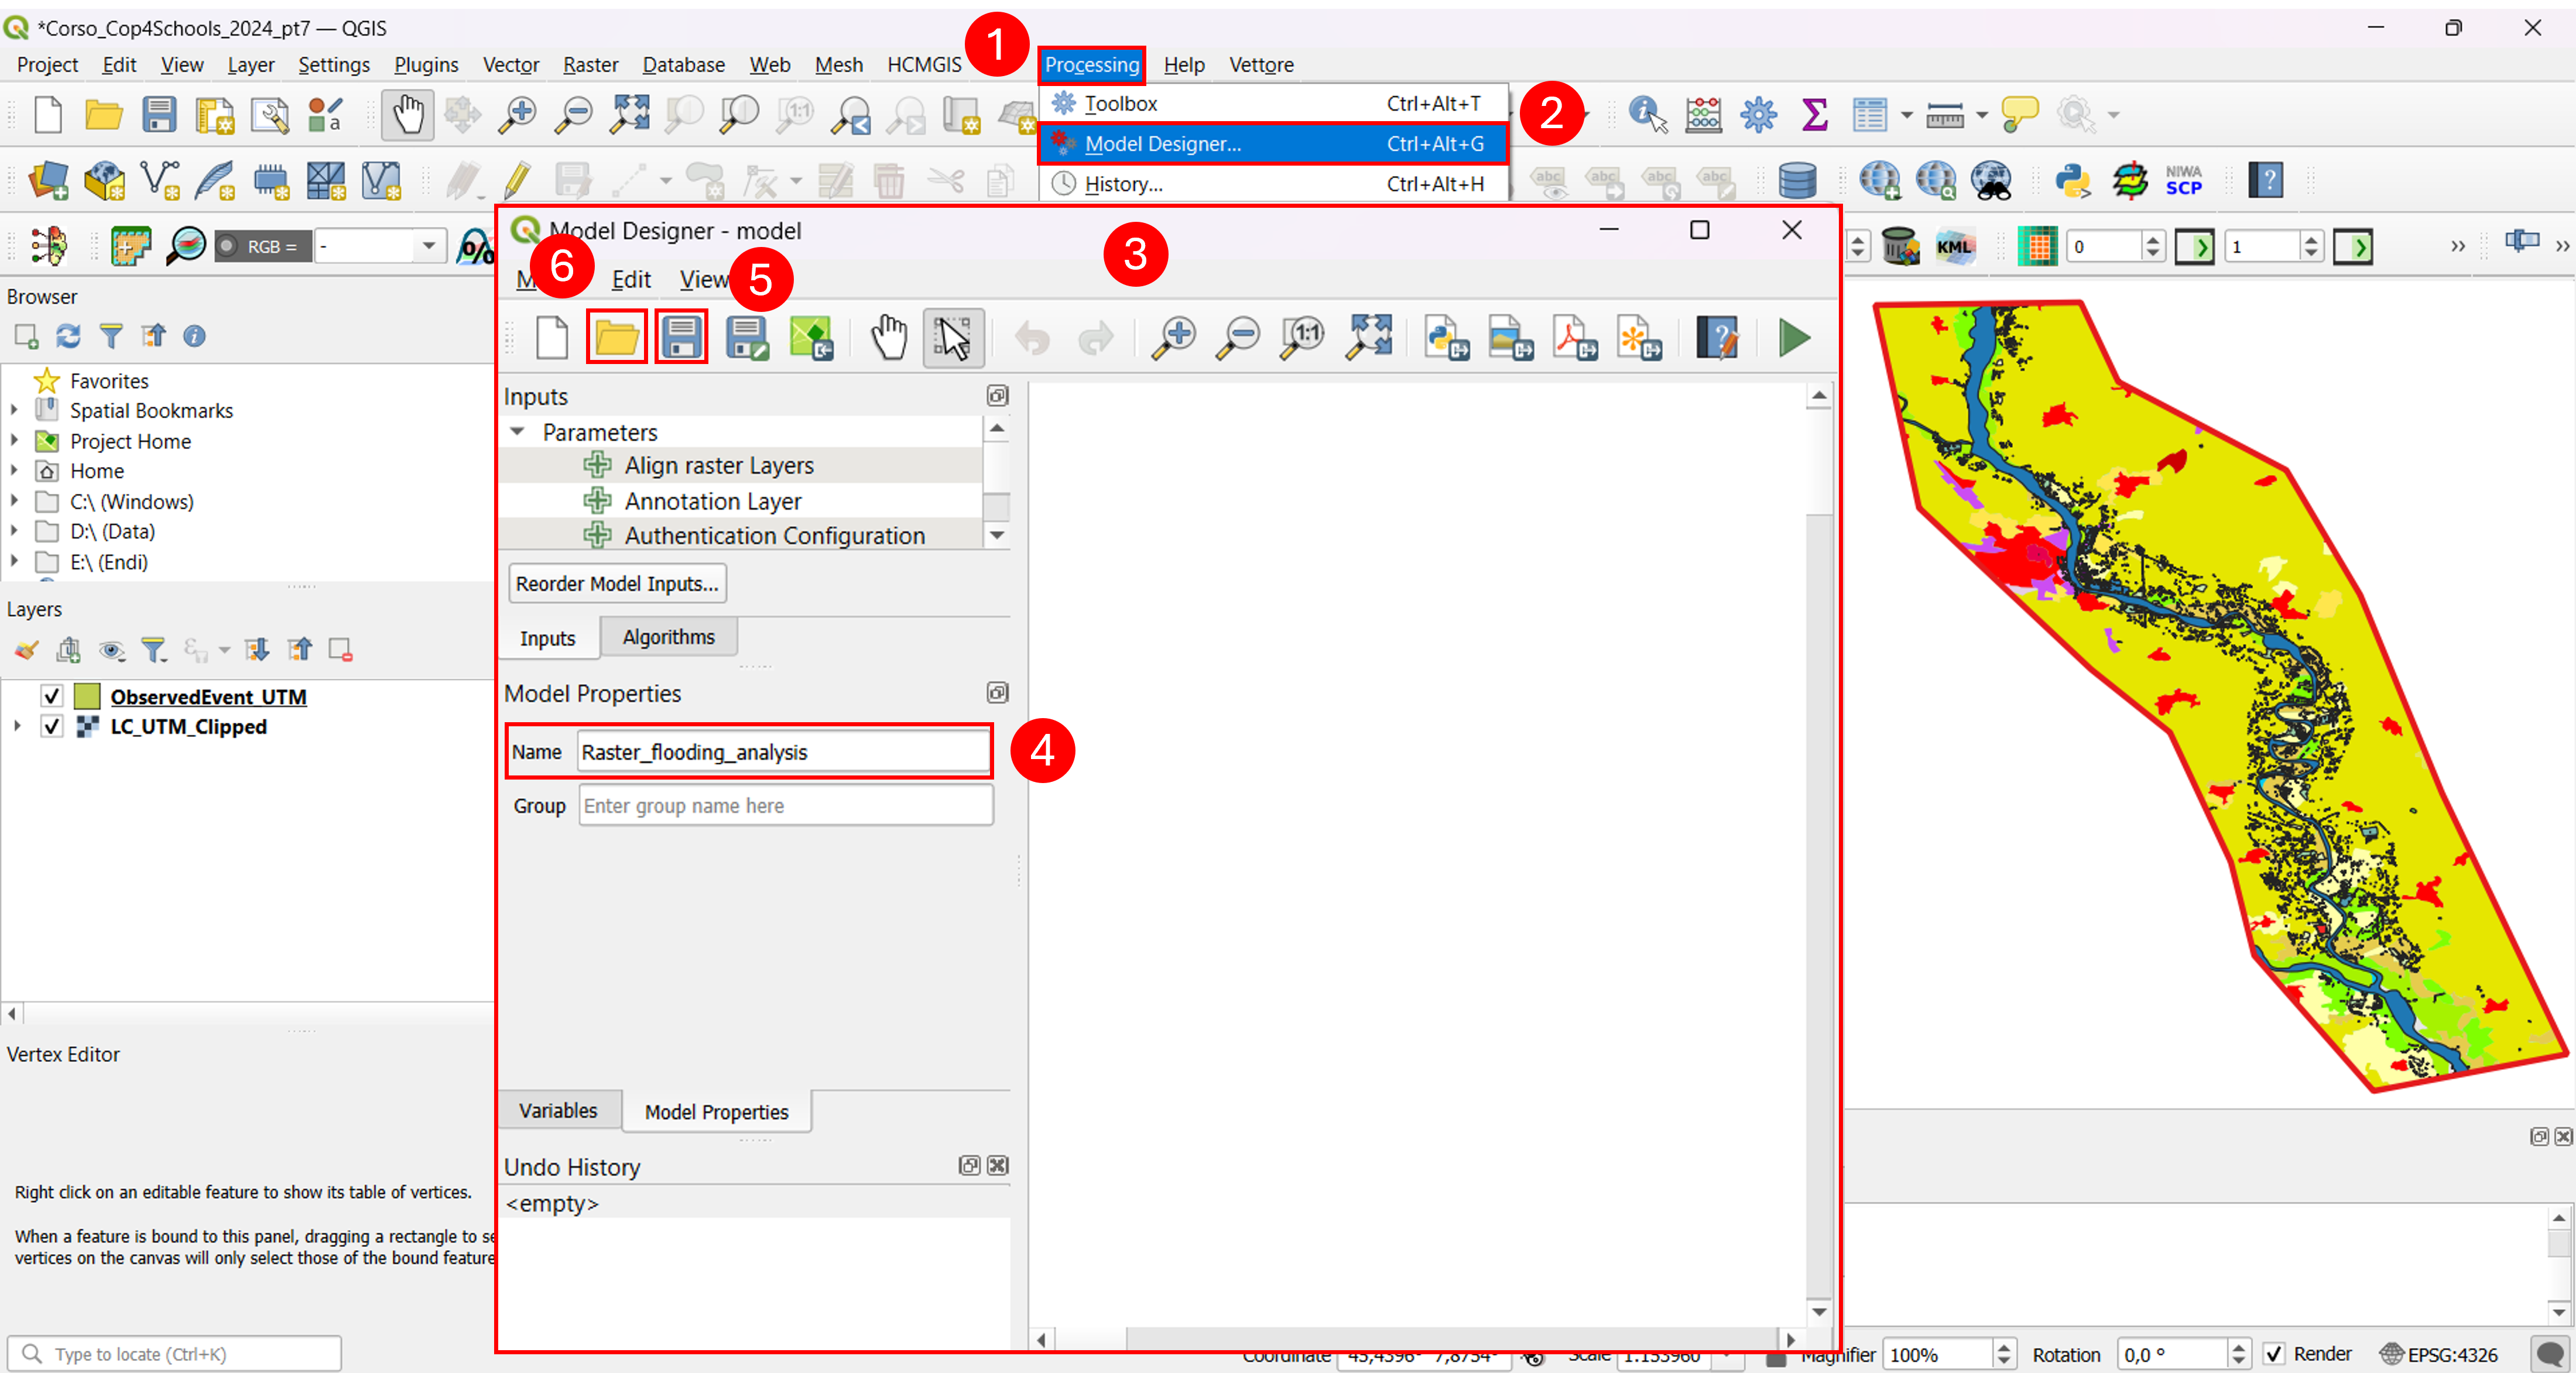
Fig. 3.2.1 – Model Designer
The model we are going to use is reported in Fig. 3.2.2 .
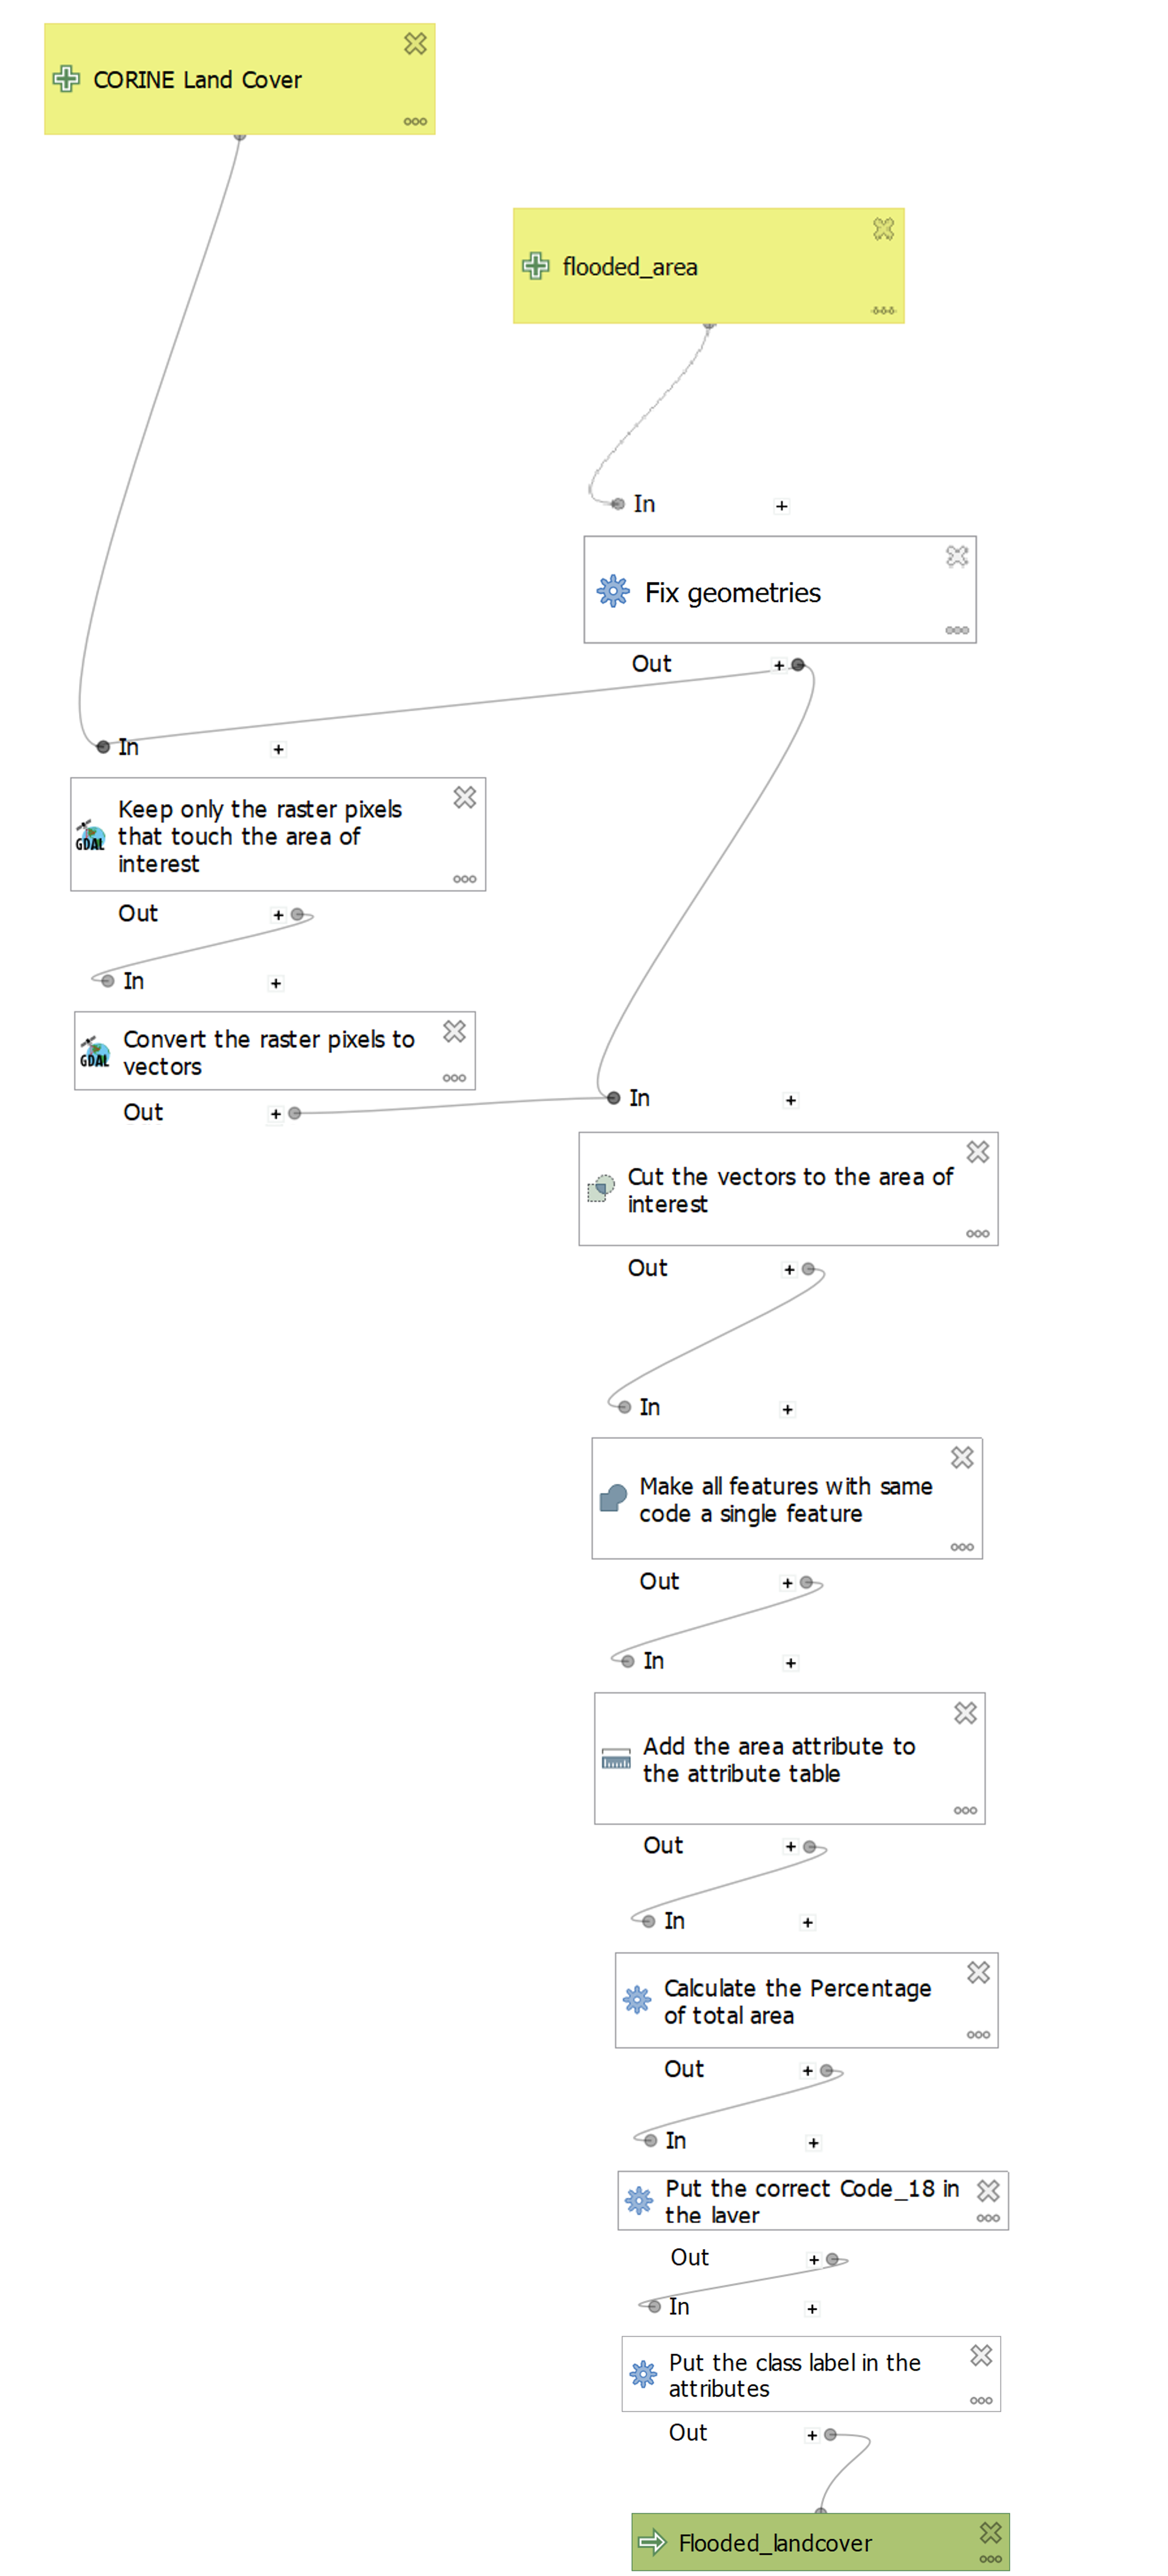
Fig. 3.2.2 – Model Designer - final model
The first step when building a model is to set the input layers (Fig. 3.2.3) . In this case, we will use the CORINE Land Cover layer (“LC_Clipped”) (1) and the layer with the flooded areas (“EMSR468_AOI05_DEL_PRODUCT_observedEventA_r1_v1”) (2). You can see that both inputs have been set as Mandatory (3), this is because both inputs are necessary to make the model work. Another thing to note is that on the input on the right we have the option to add the Geometry type (4): this means that we are importing vector data.
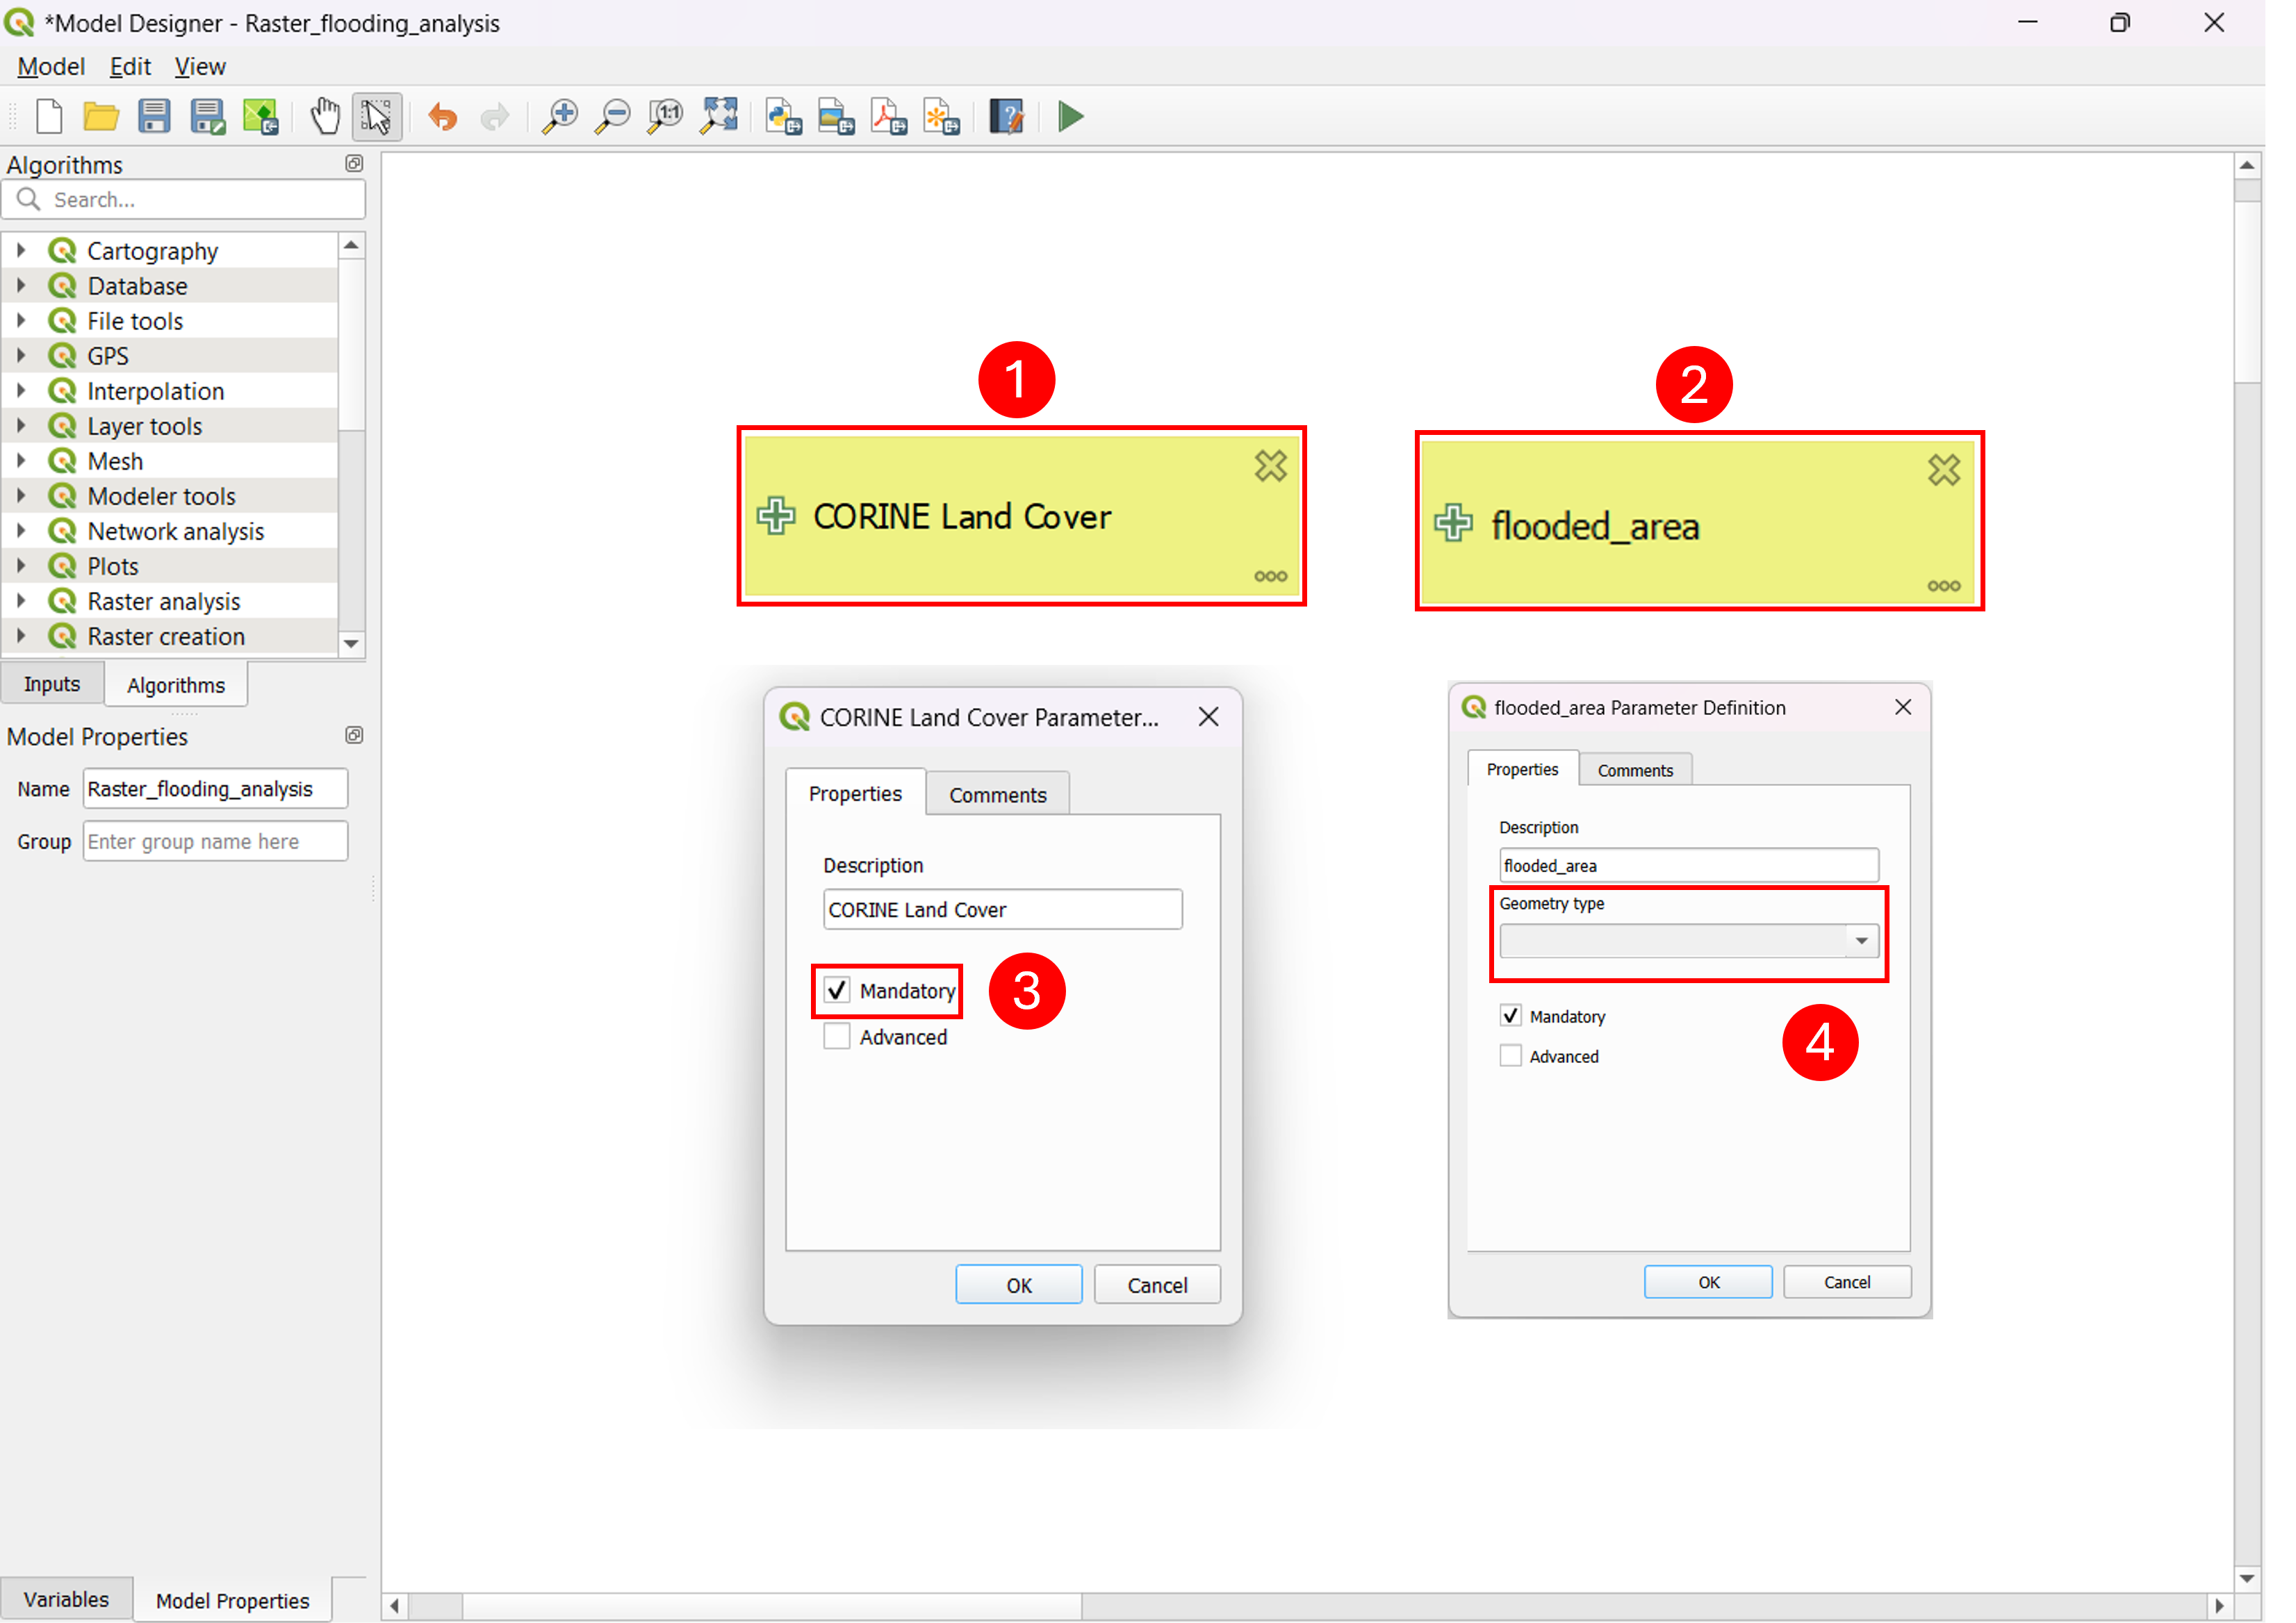
Fig. 3.2.3 – Model Designer - input layers
The next step (Fig. 3.2.4) is the geometry fix (1). You can notice that the Input of this block is connected to the flooded area layer: this means that the geometry fixing is applied over the flooded area layer. This algorithm is used to repair issues or errors that can emerge when working with vector data, especially when conversion or digitalisation procedures are applied.
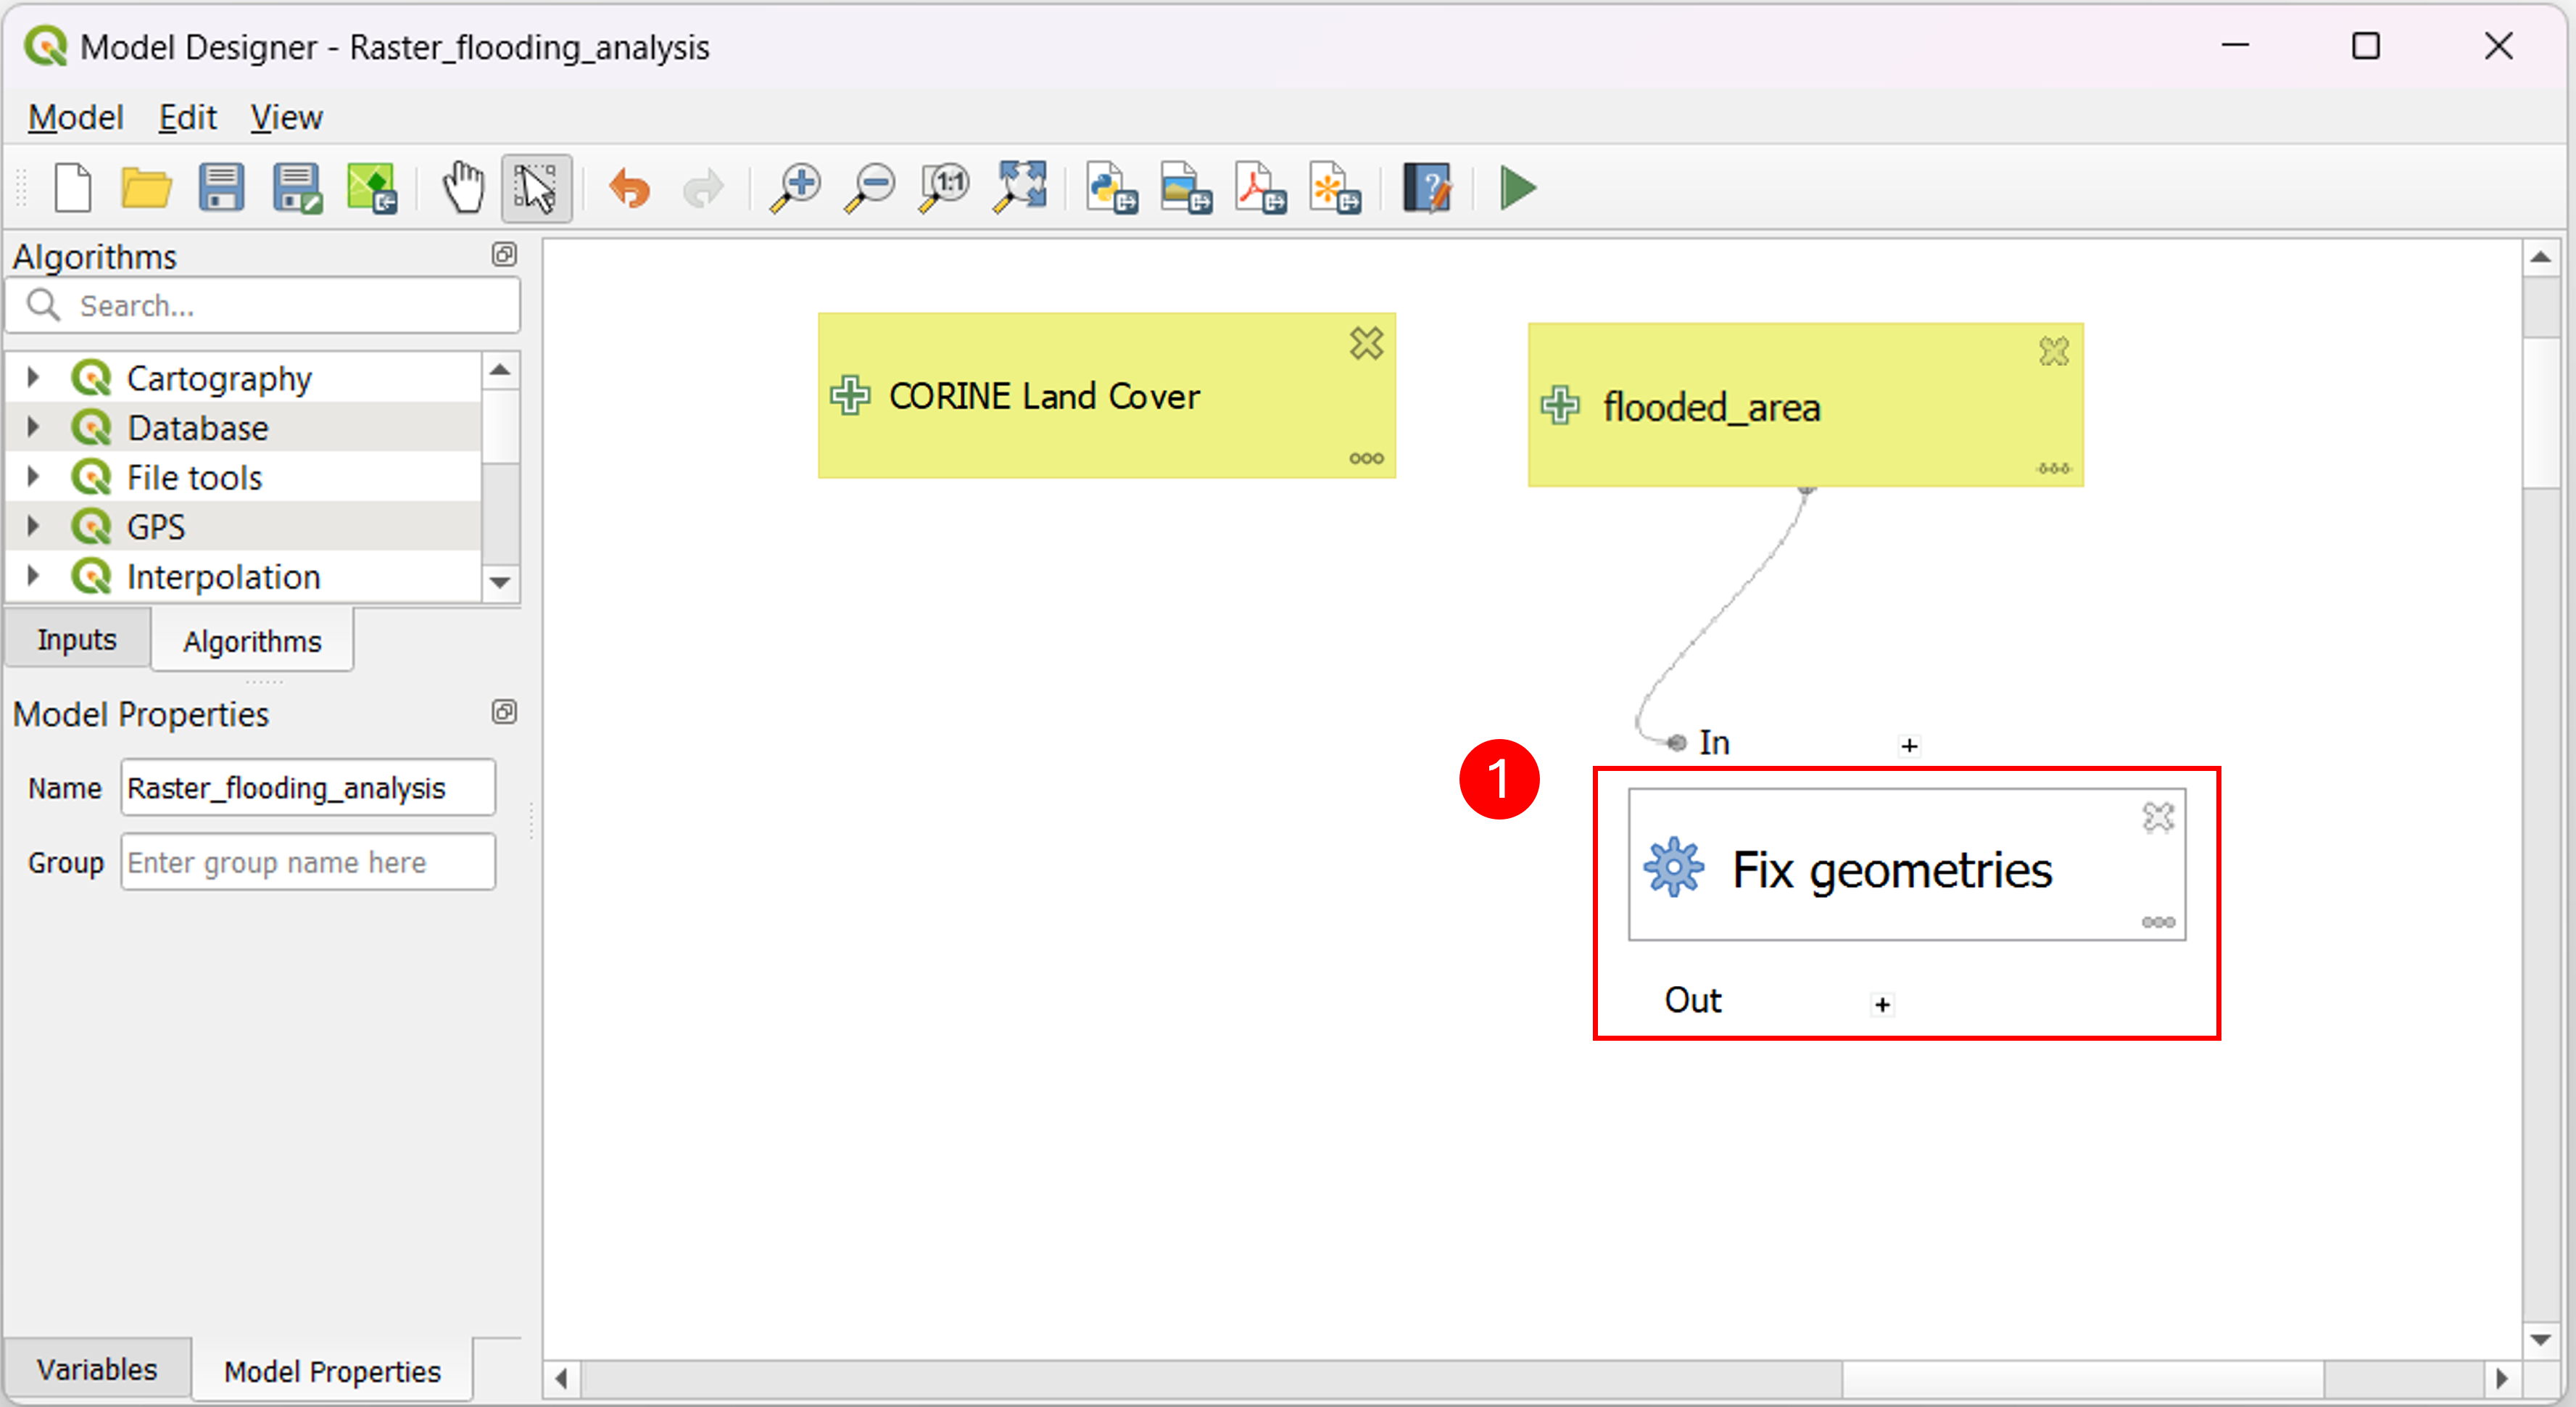
Fig. 3.2.4 – Model Designer - geometry fix
The next step is depicted in Fig. 3.2.5 . At first we will use the Clip raster by mask layer tool (1) in order to reduce the computational burden of the following operations. As you can see, the input of this block is composed of the CORINE Land Cover layer, which is the layer we are going to clip, and the flooded area layer with fixed geometries. As a second step, we will convert the obtained raster layer to a vector format (2). With this procedure, each cell of the raster will become a polygon. Within this step, we add a column to maintain the information (the cell code) regarding that cell.
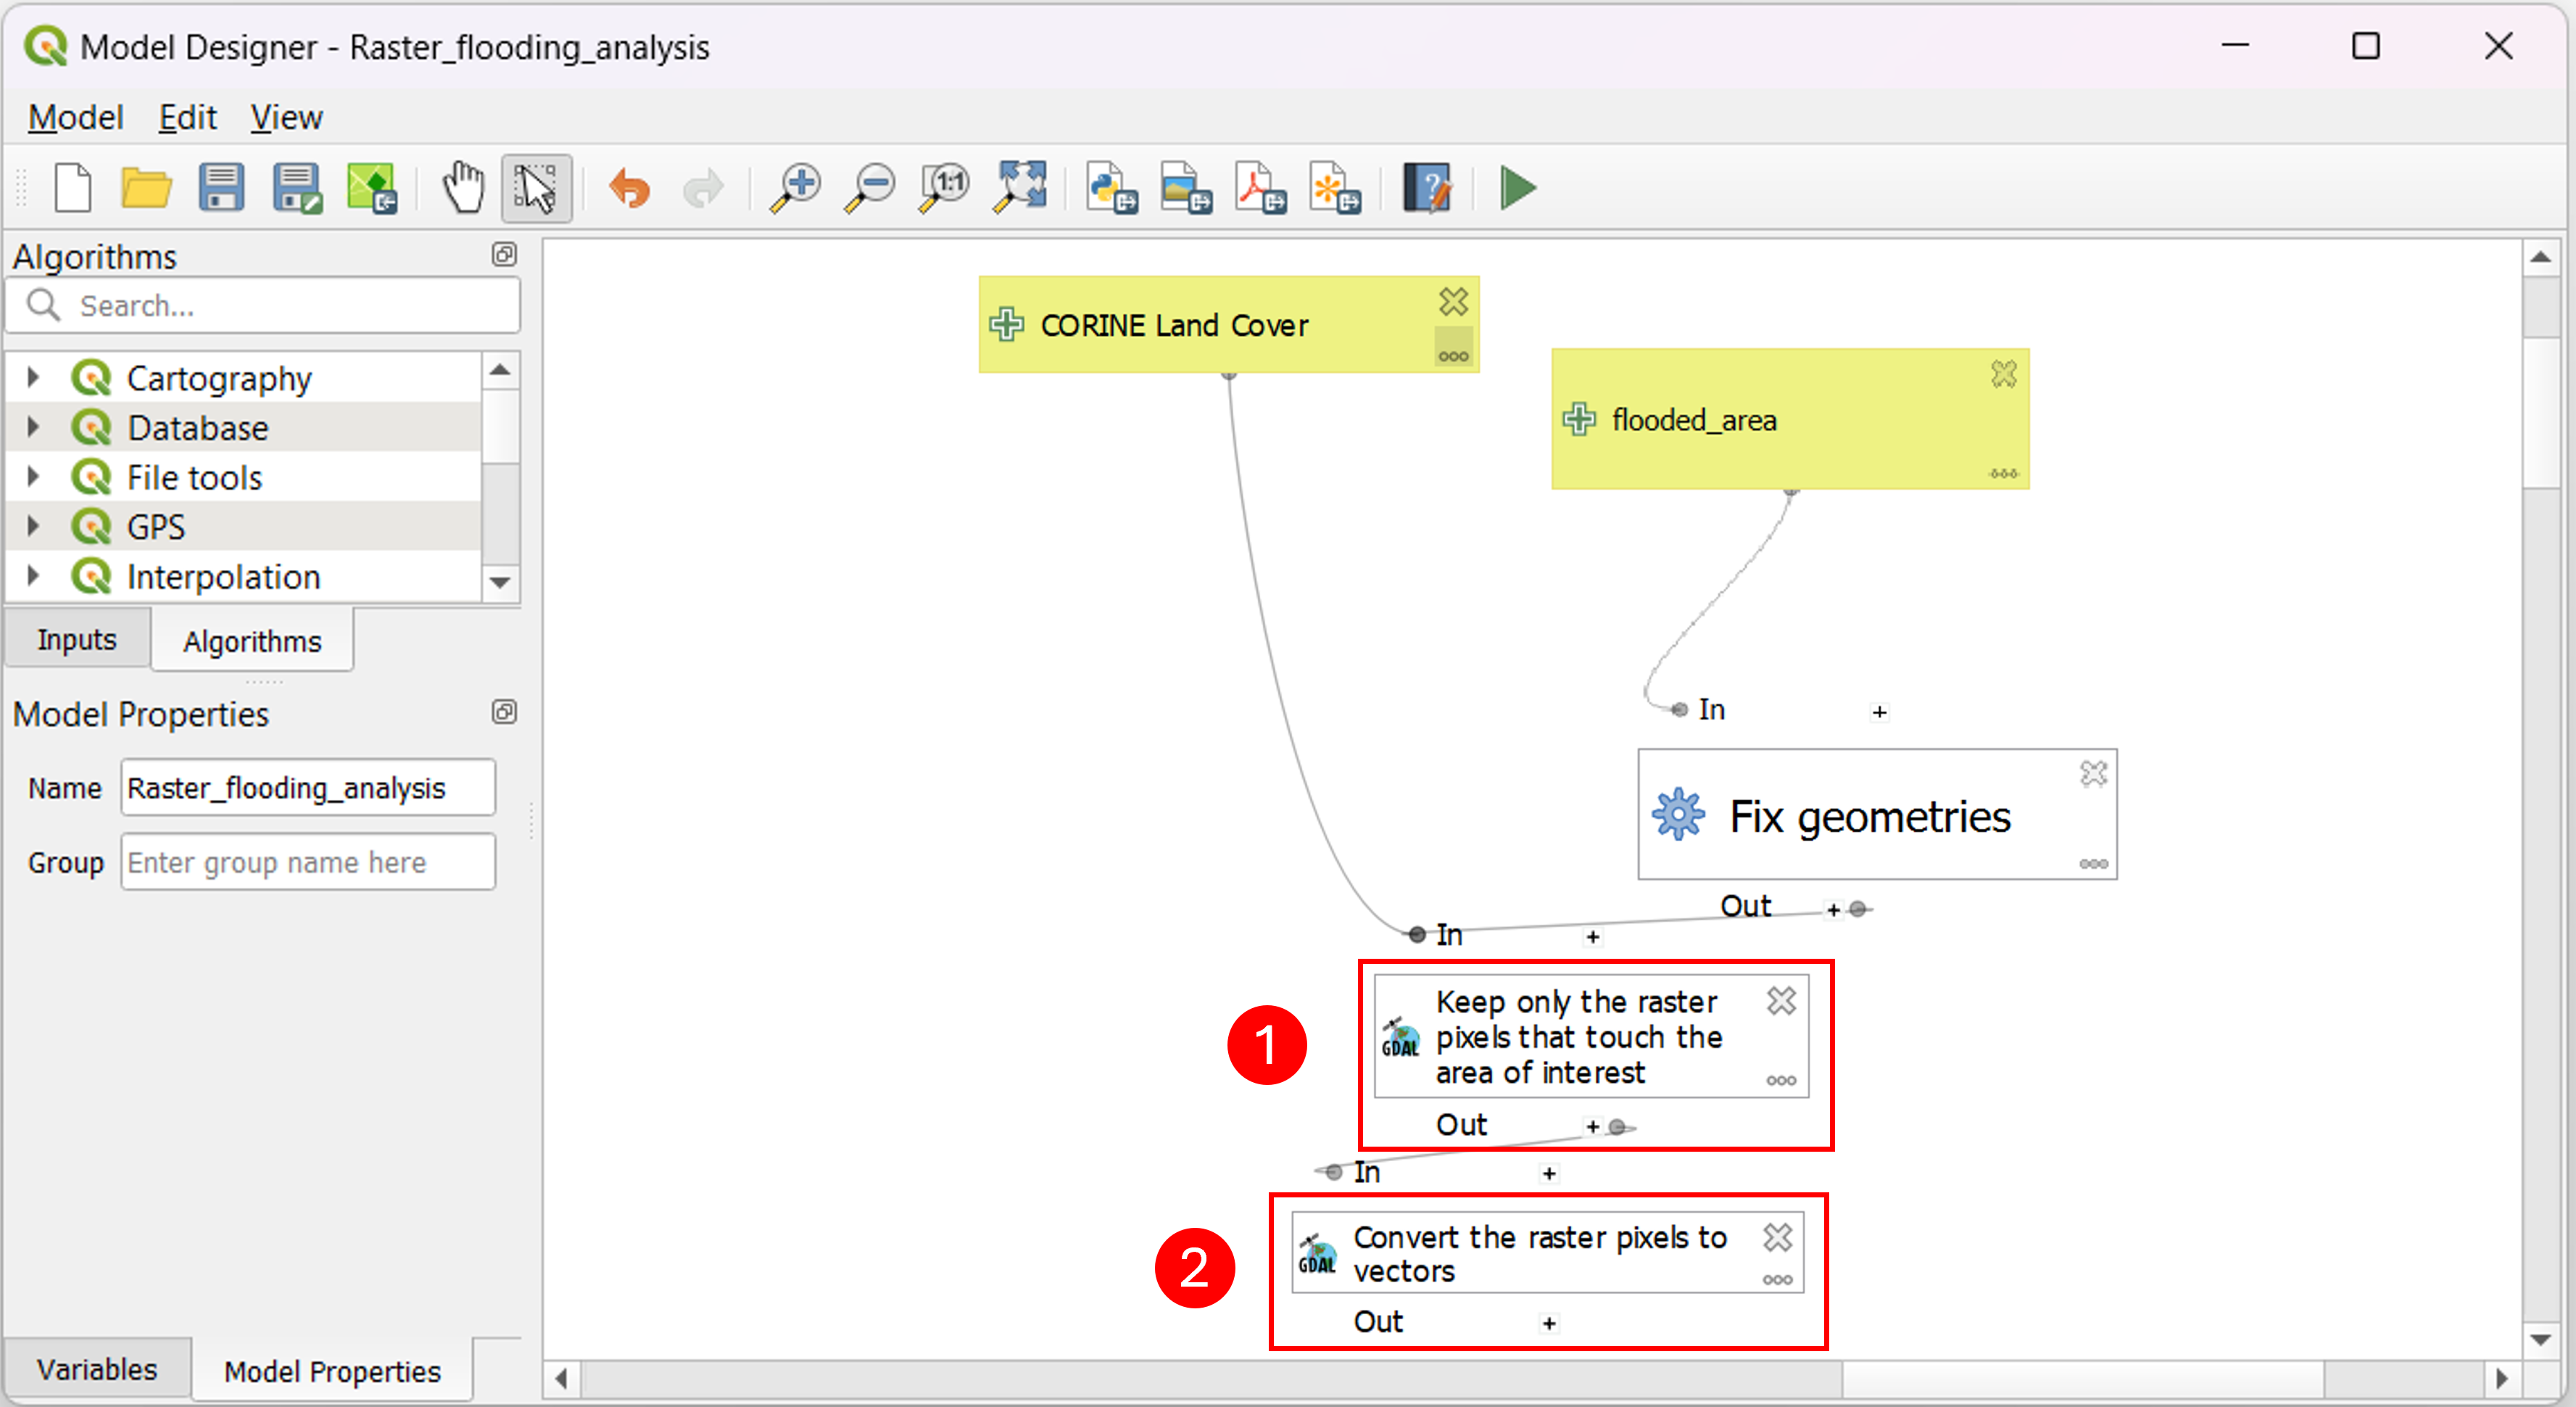
Fig. 3.2.5 – Model Designer - clip and polygonize
In Fig. 3.2.6 , the next two steps are shown. The first one involves cutting the land cover layer converted to a vector over the flooded area (1). Then we apply the Dissolve algorithm (2) which is used to merge adjacent or overlapping polygons of the layer set as input, based on an attribute. In this case, we combine polygons based on the cell code.
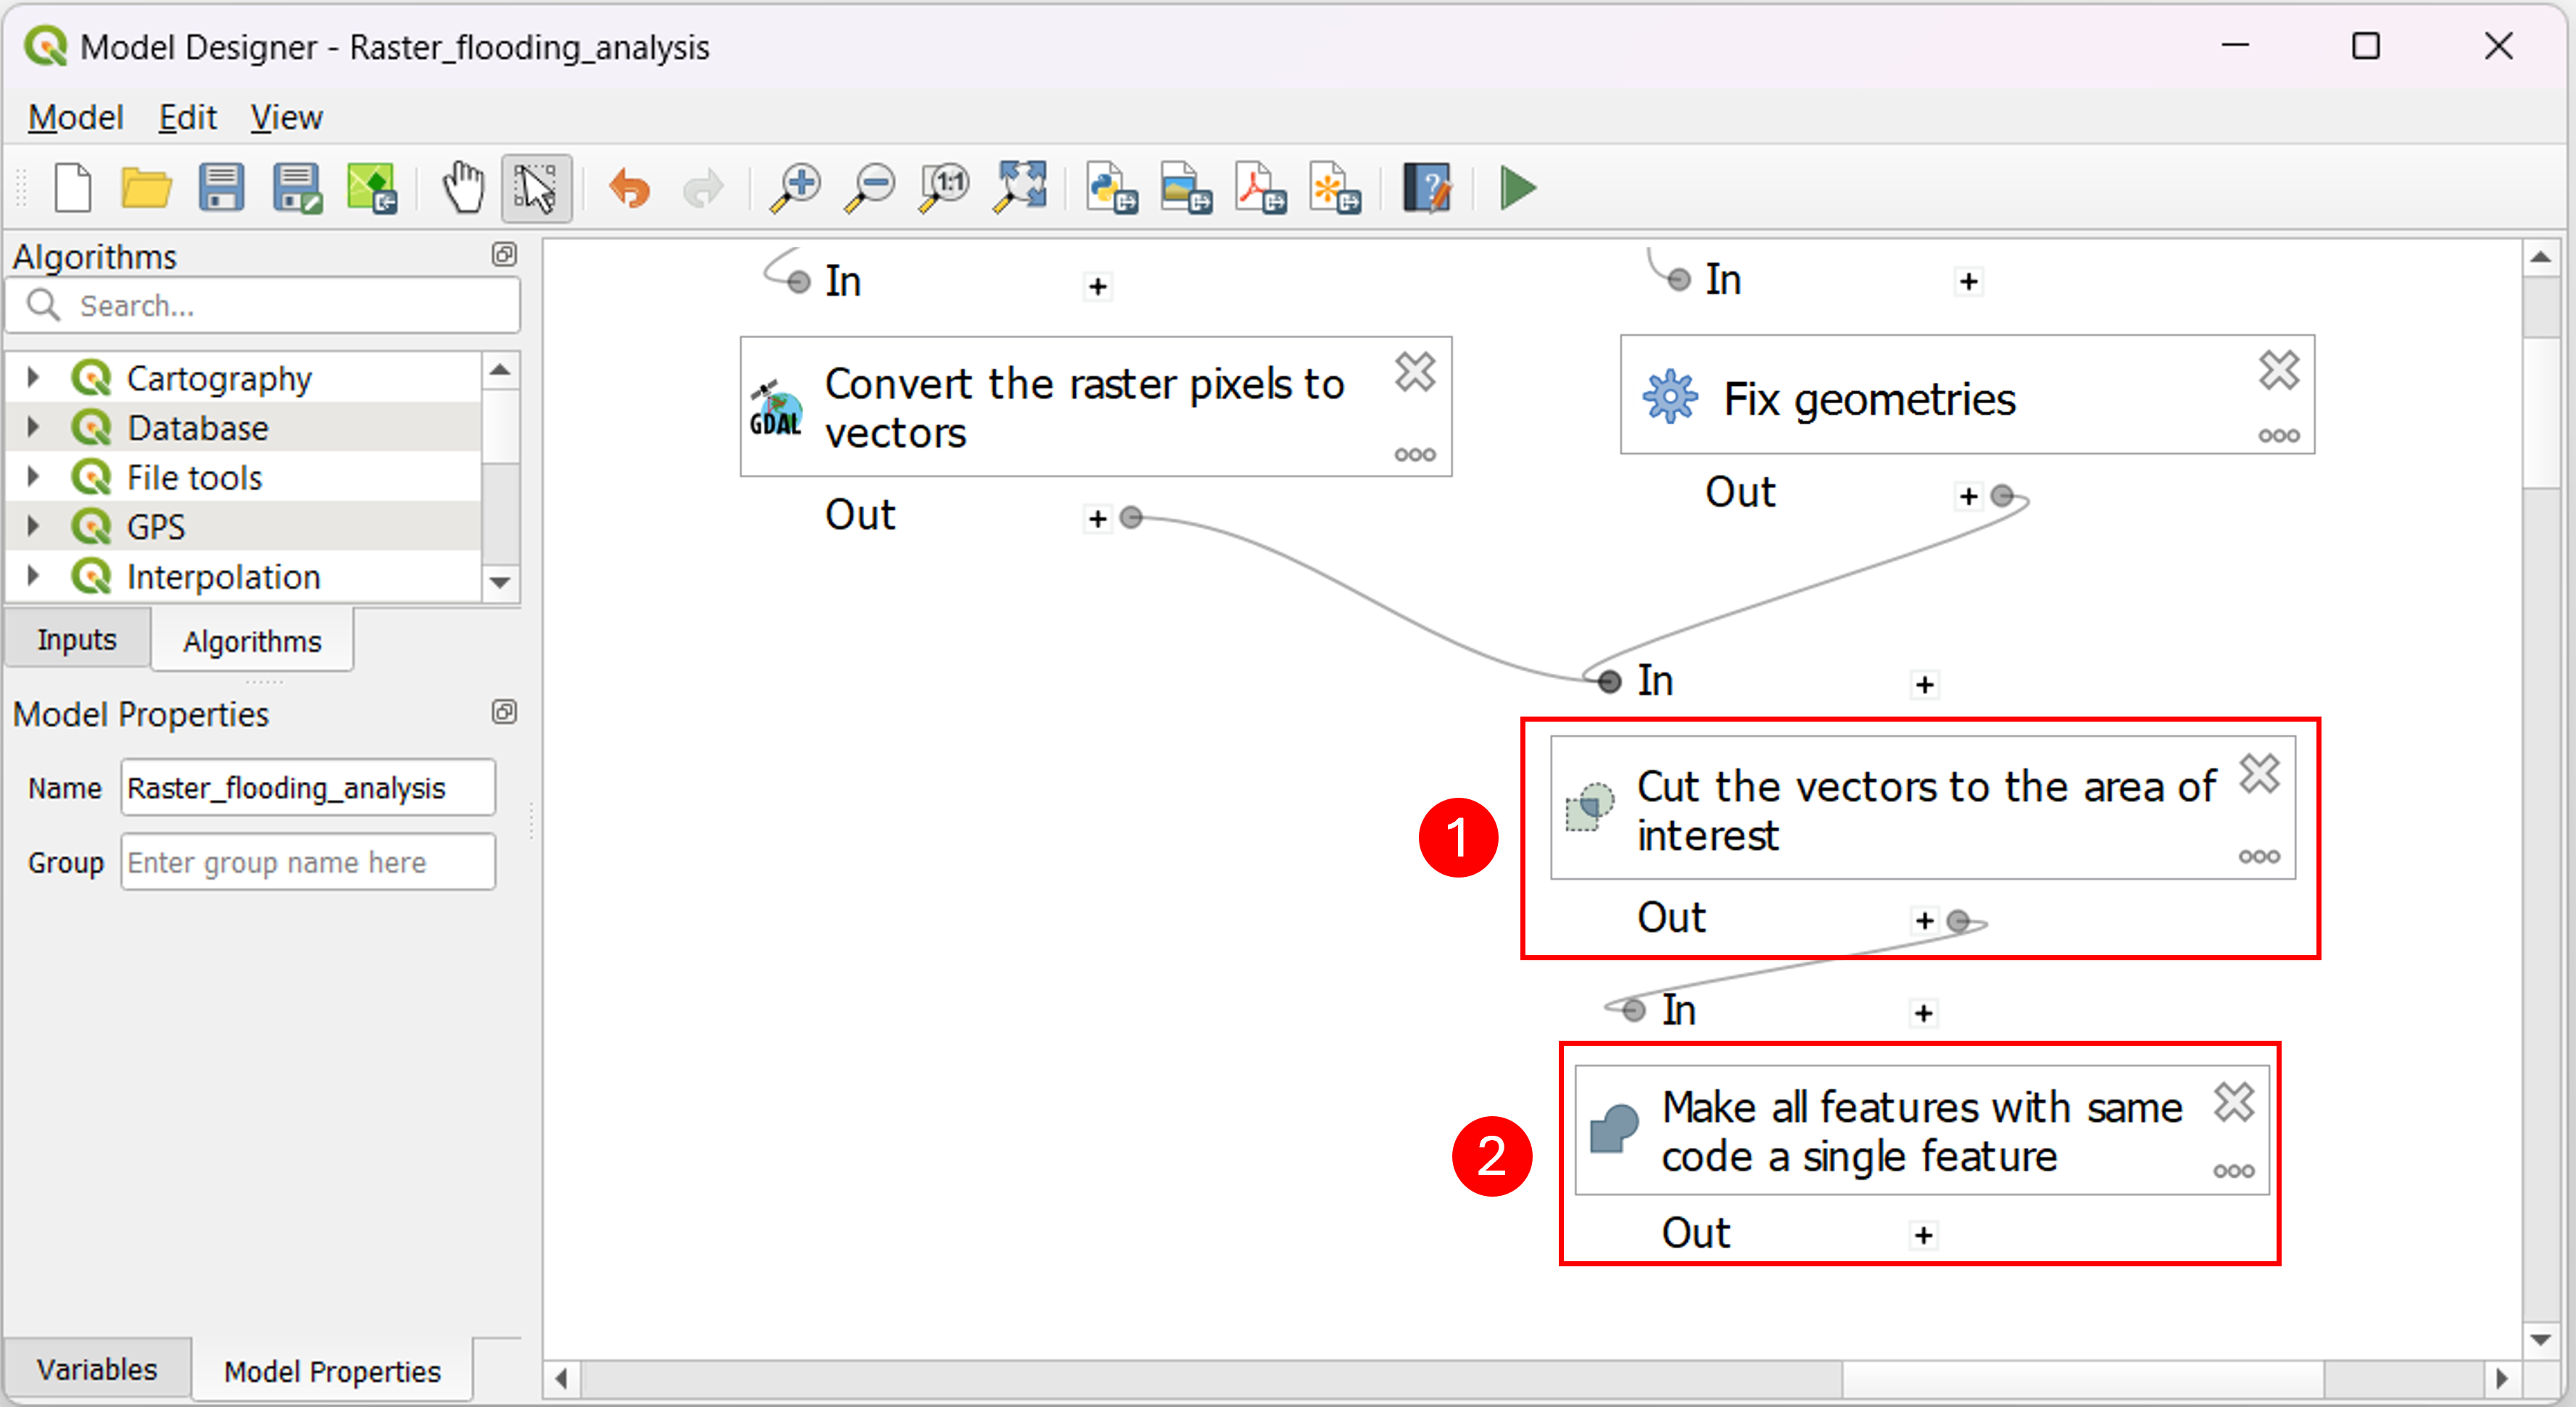
Fig. 3.2.6 – Model Designer - clip and dissolve
Now it is necessary to compute the area of the combined polygons (1) (Fig. 3.2.7) . This procedure allows us to compute, for each land cover, the percentage of flooded area with respect to the total flooded area (2). The formula used to compute such a percentage is:
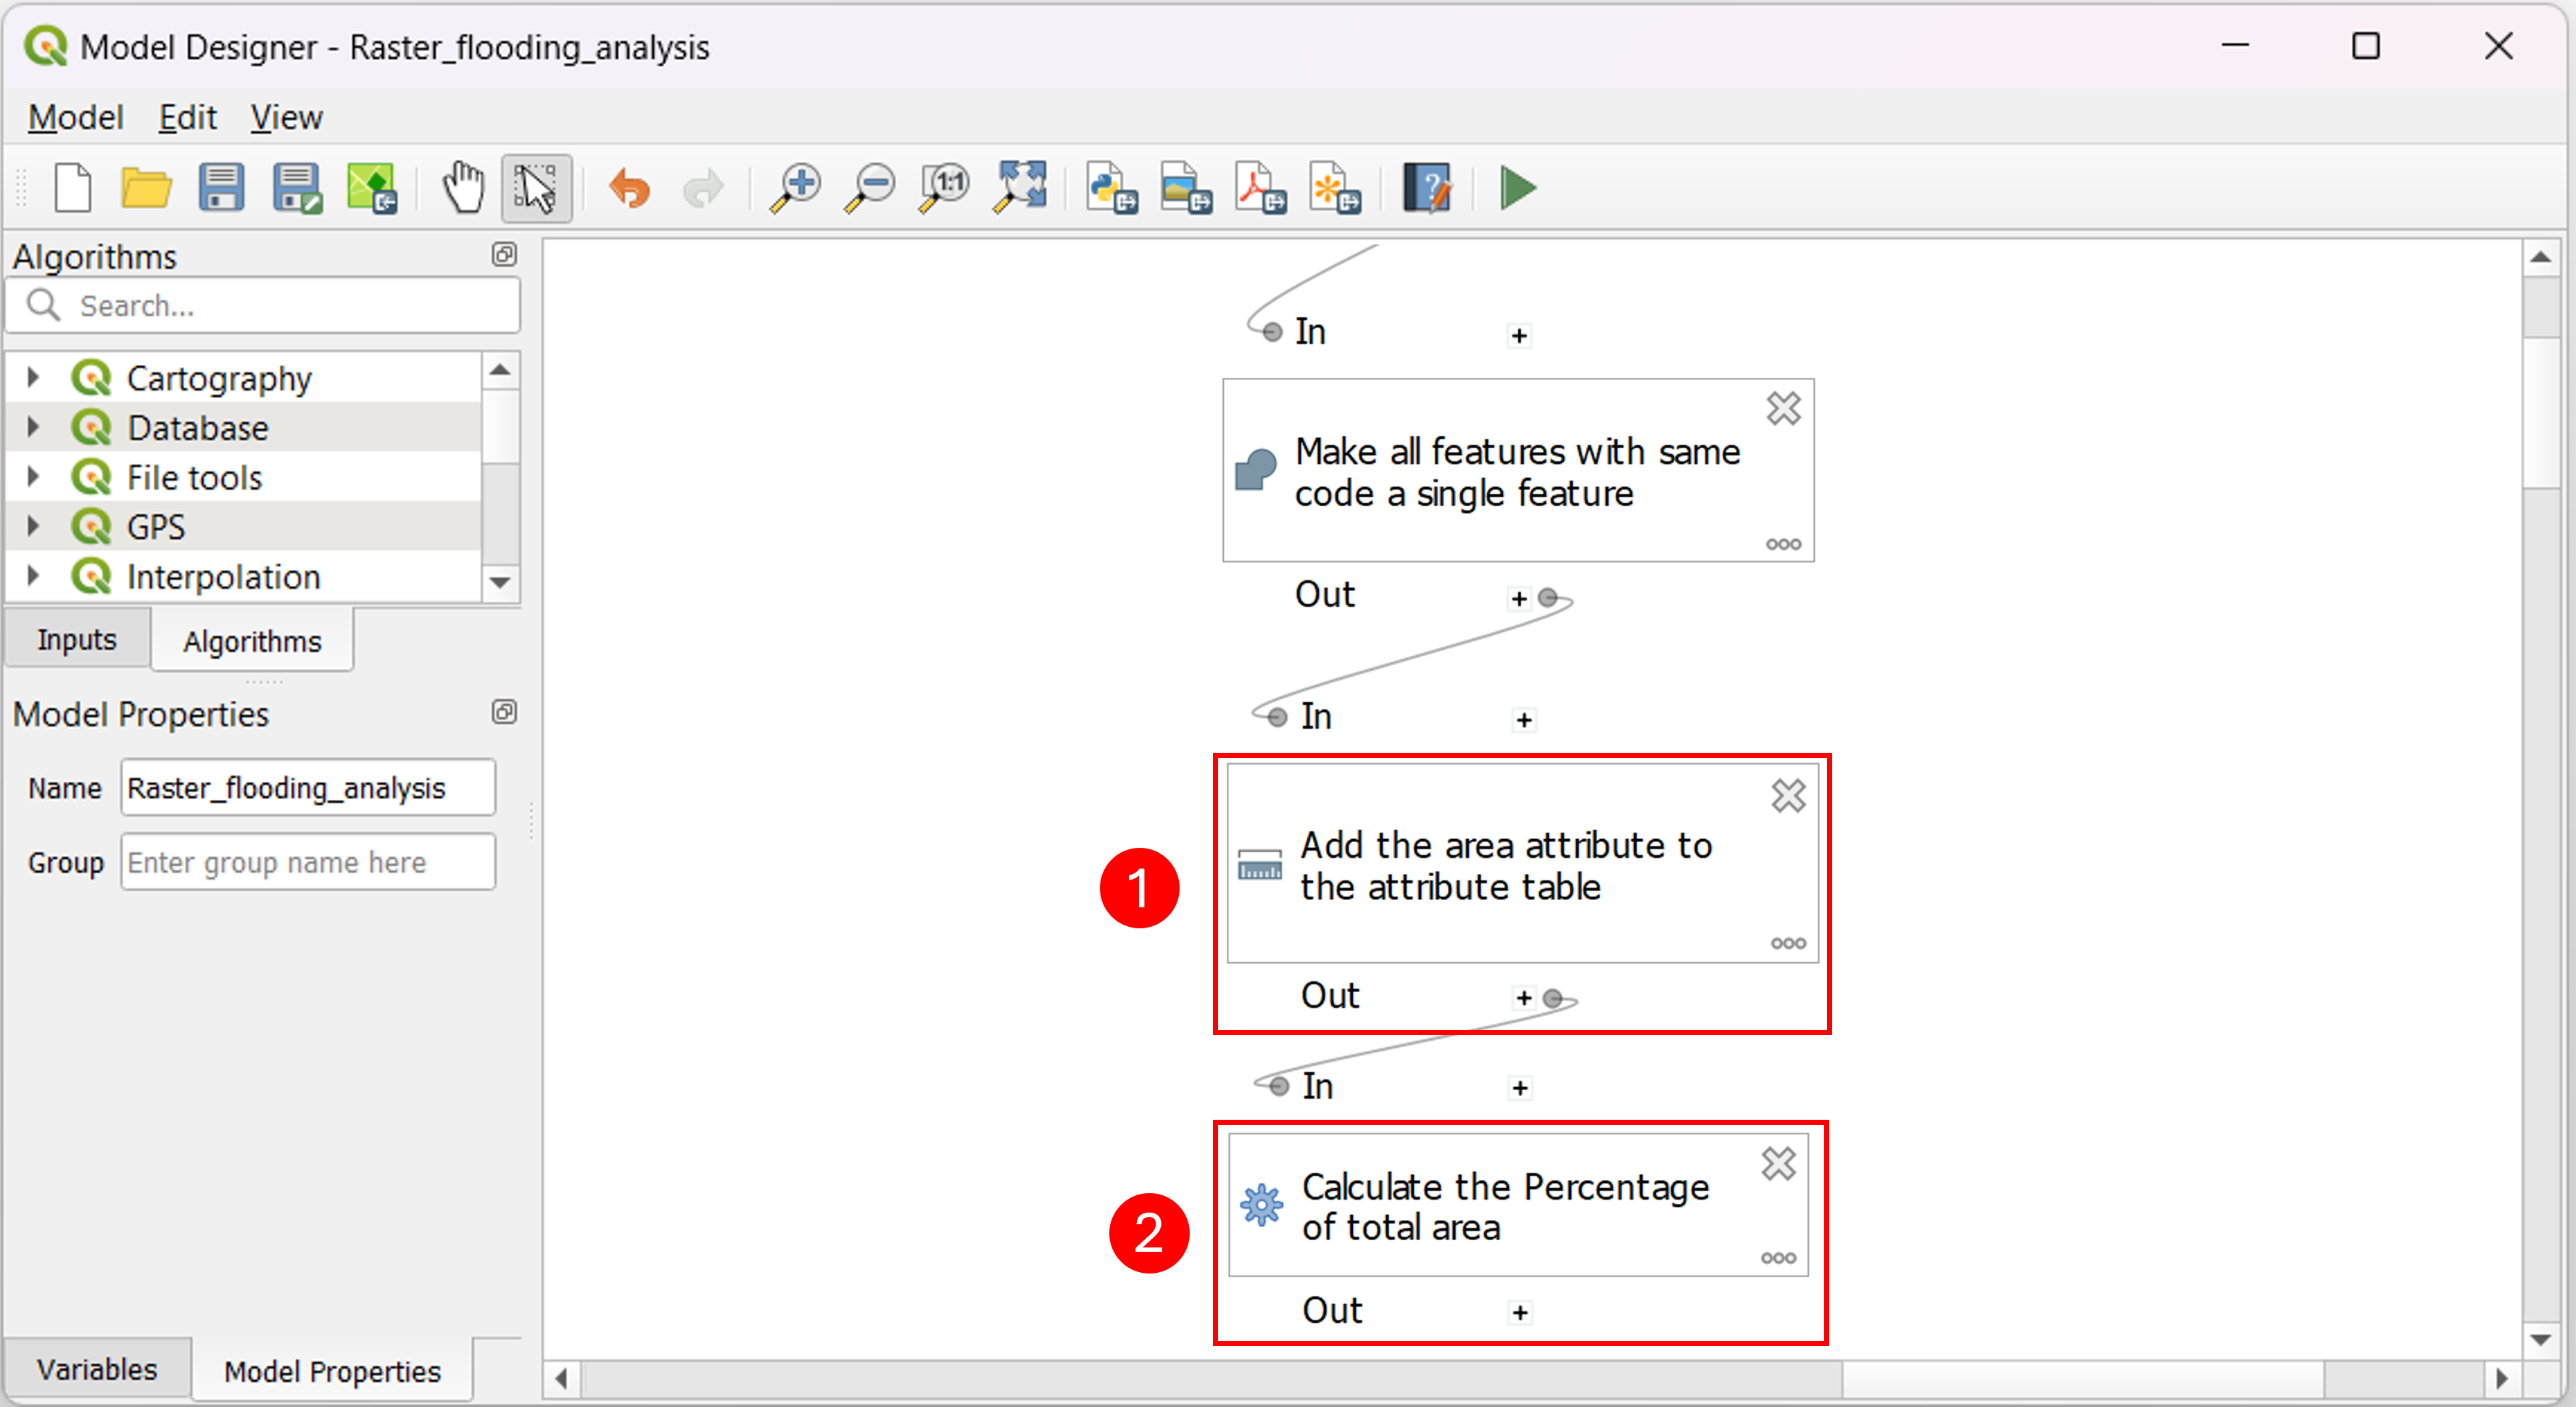
Fig. 3.2.7 – Model Designer - percentage computation
In the following two steps, shown in Fig. 3.2.8 , we use the field calculator, initially to change the feature code to the code corresponding to the correct land cover class (1) and then to add a field continuing the label for each code (2). The last block of the model (3) represents the output and it will be added to the Layers once the computation is done.
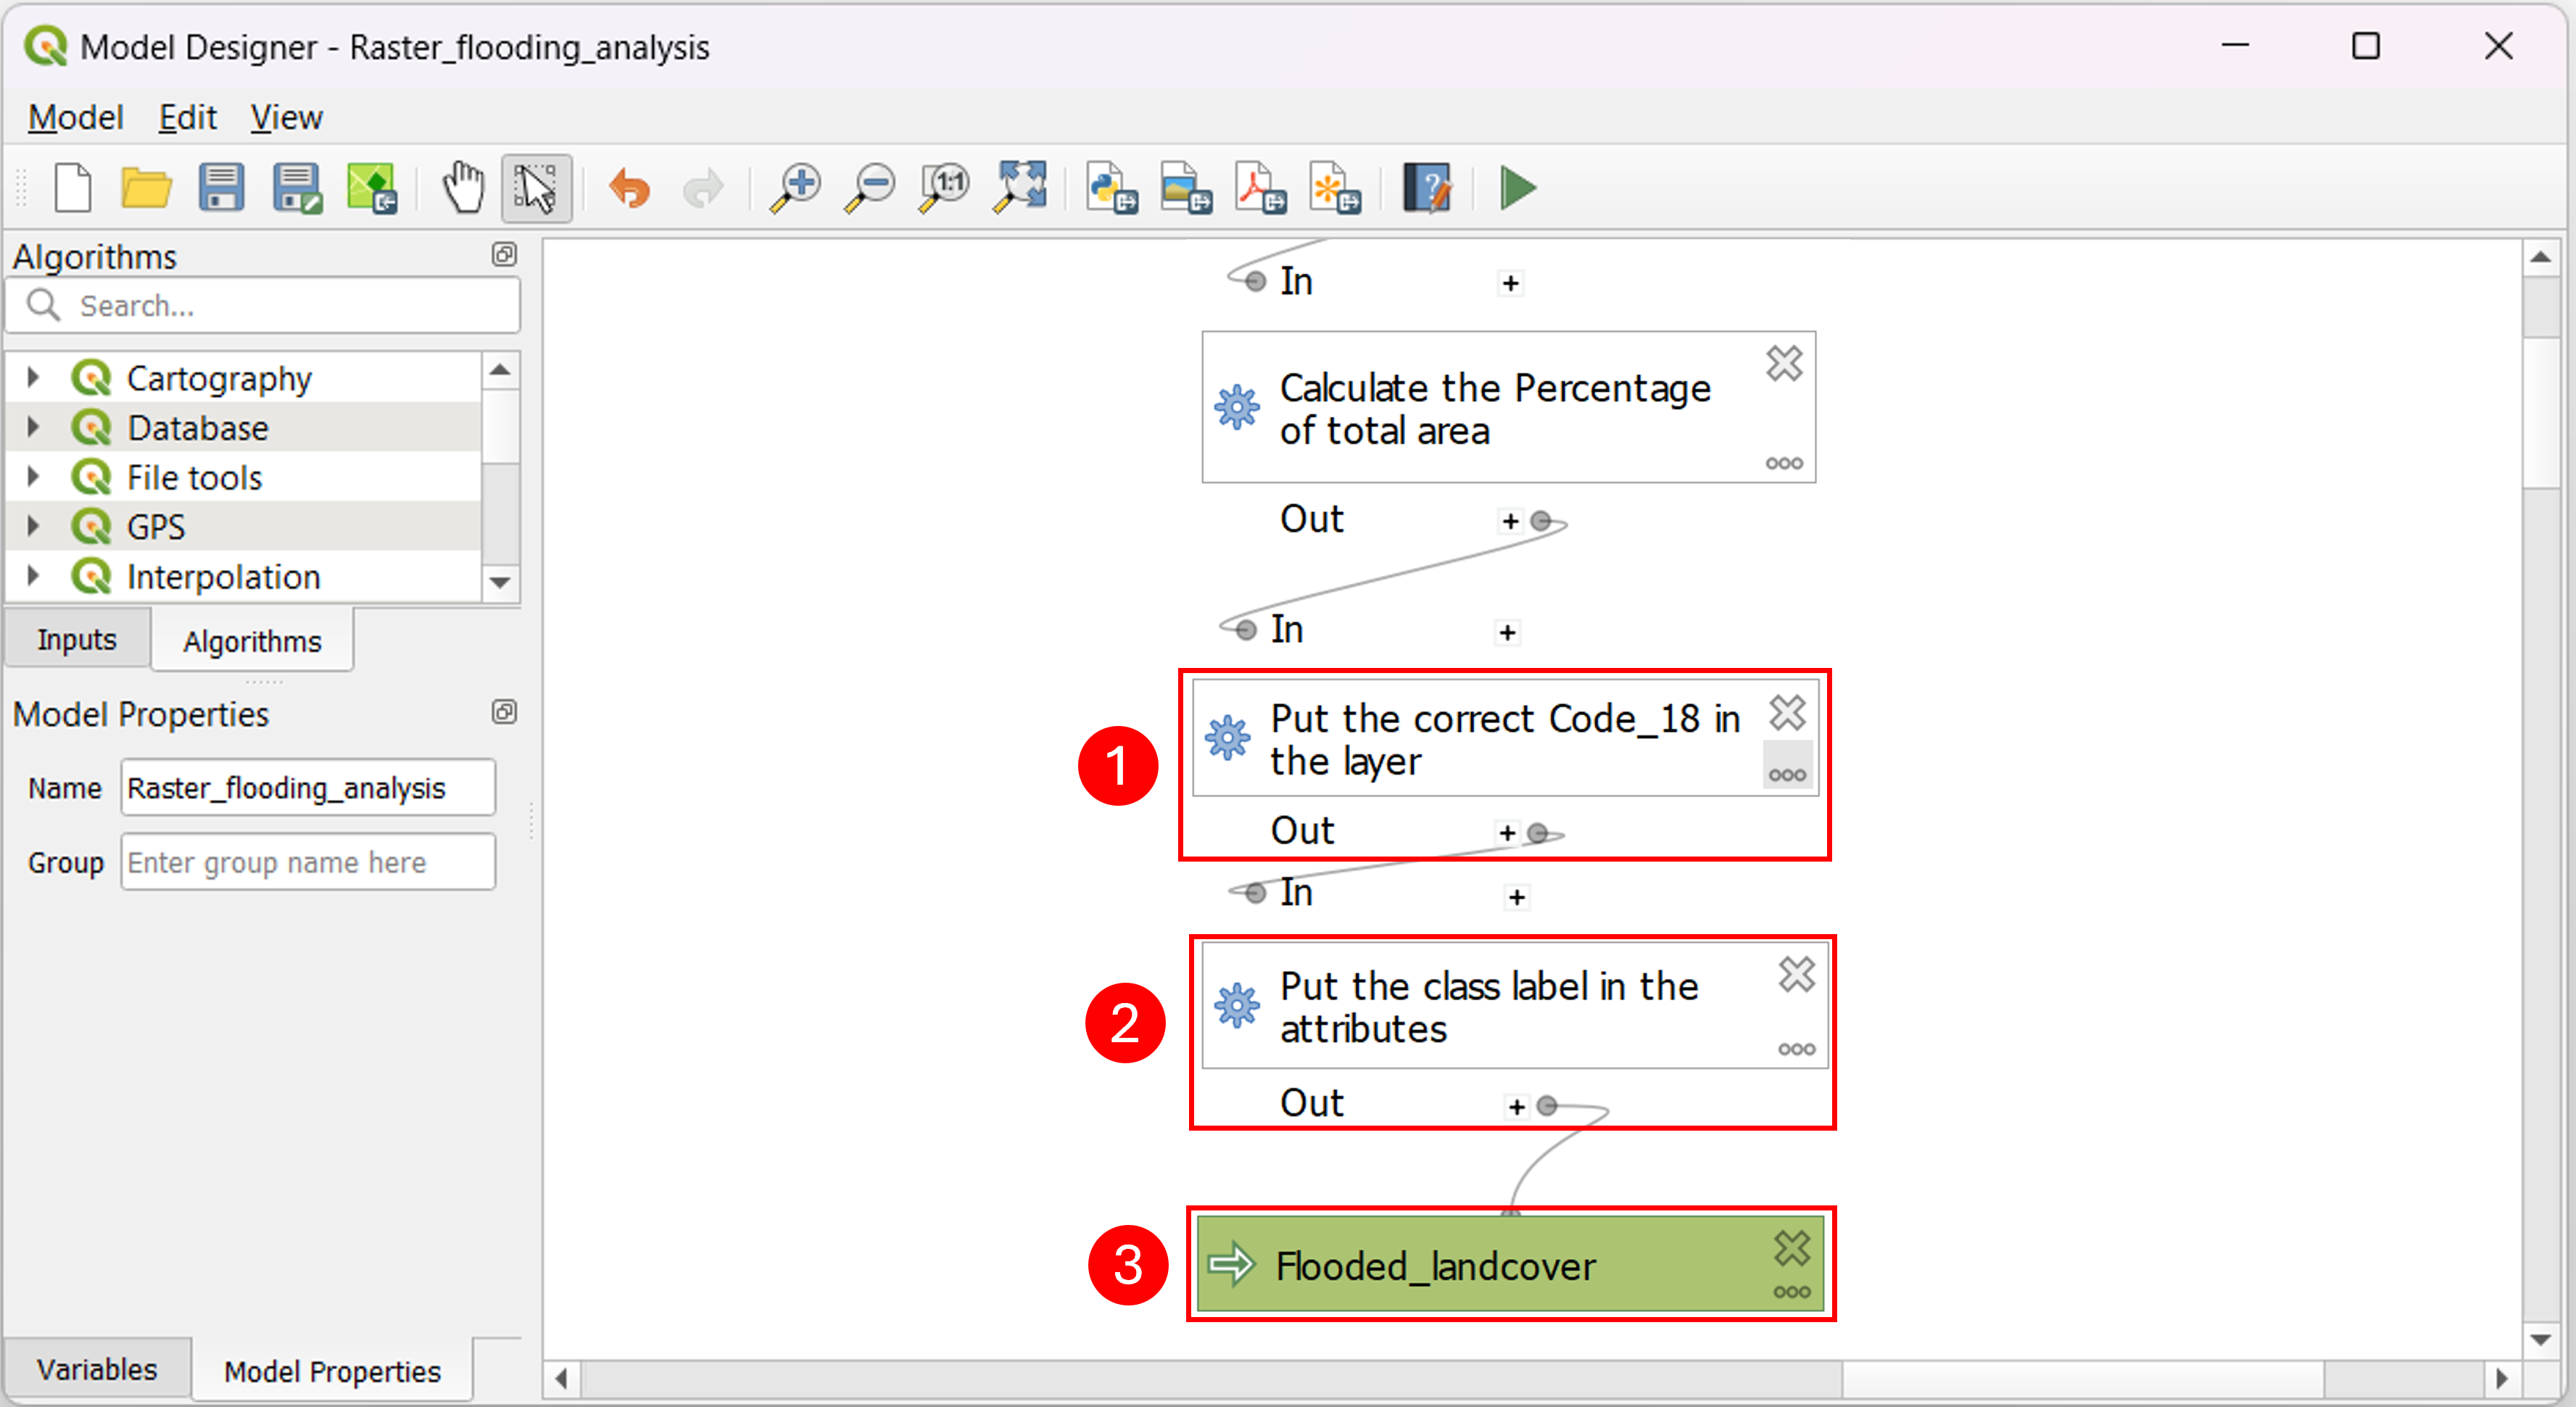
Fig. 3.2.8 – Model Designer - add labels
Click on the green player button to run the algorithm (1) (Fig. 3.2.9) . You will be asked to choose the layer that will represent the input to the model. Set the CORINE Land Cover field as “LC_UTM_Clipped” (2) and the flooded_area field as “ObservedEventA_UTM” (3). Once done, click on Run (4).
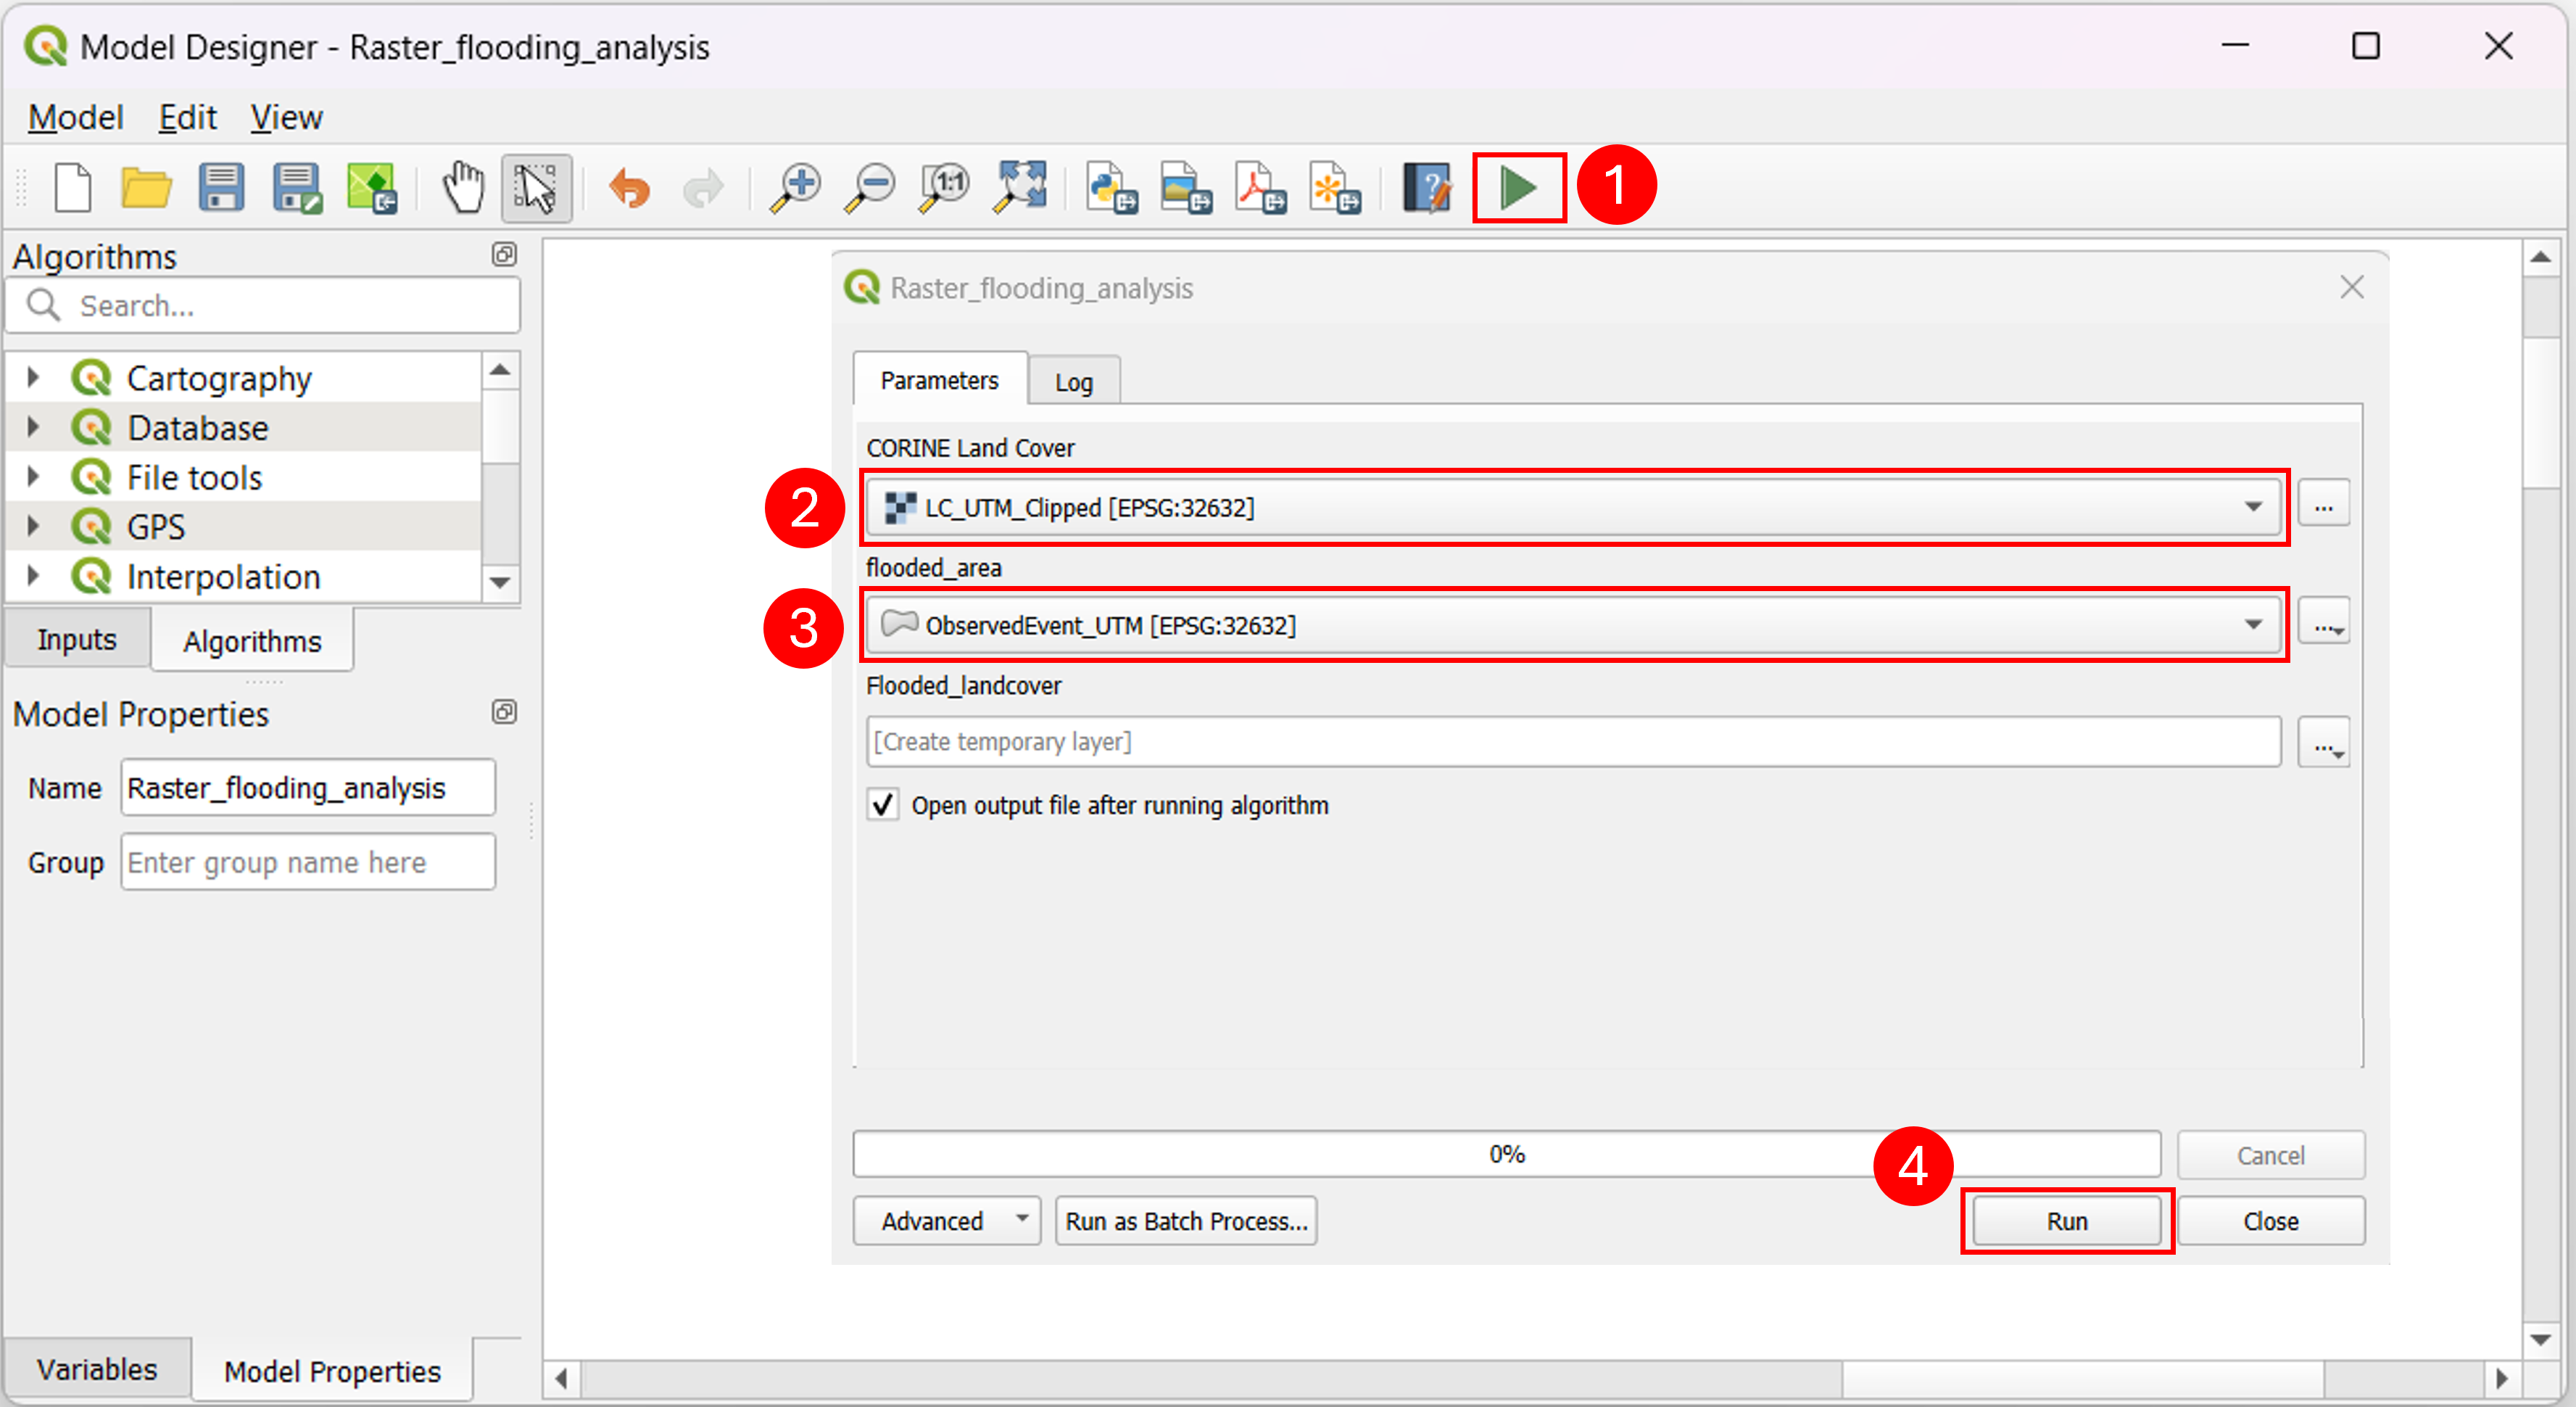
Fig. 3.2.9 – Model Designer - Run Model