3.1. Insights into the land cover classes which are most affected by flood
In this lecture we need to import into QGIS the following layers computed in lecture 5:
- LC_UTM_Clipped
- ObservedEvent_UTM
In (Fig. 3.1.1) we can see the thematic classes composing the “LC_UTM_Clipped” layer. If your layer has the default layer style and you want to add the style shown here you can follow the steps of chapter.
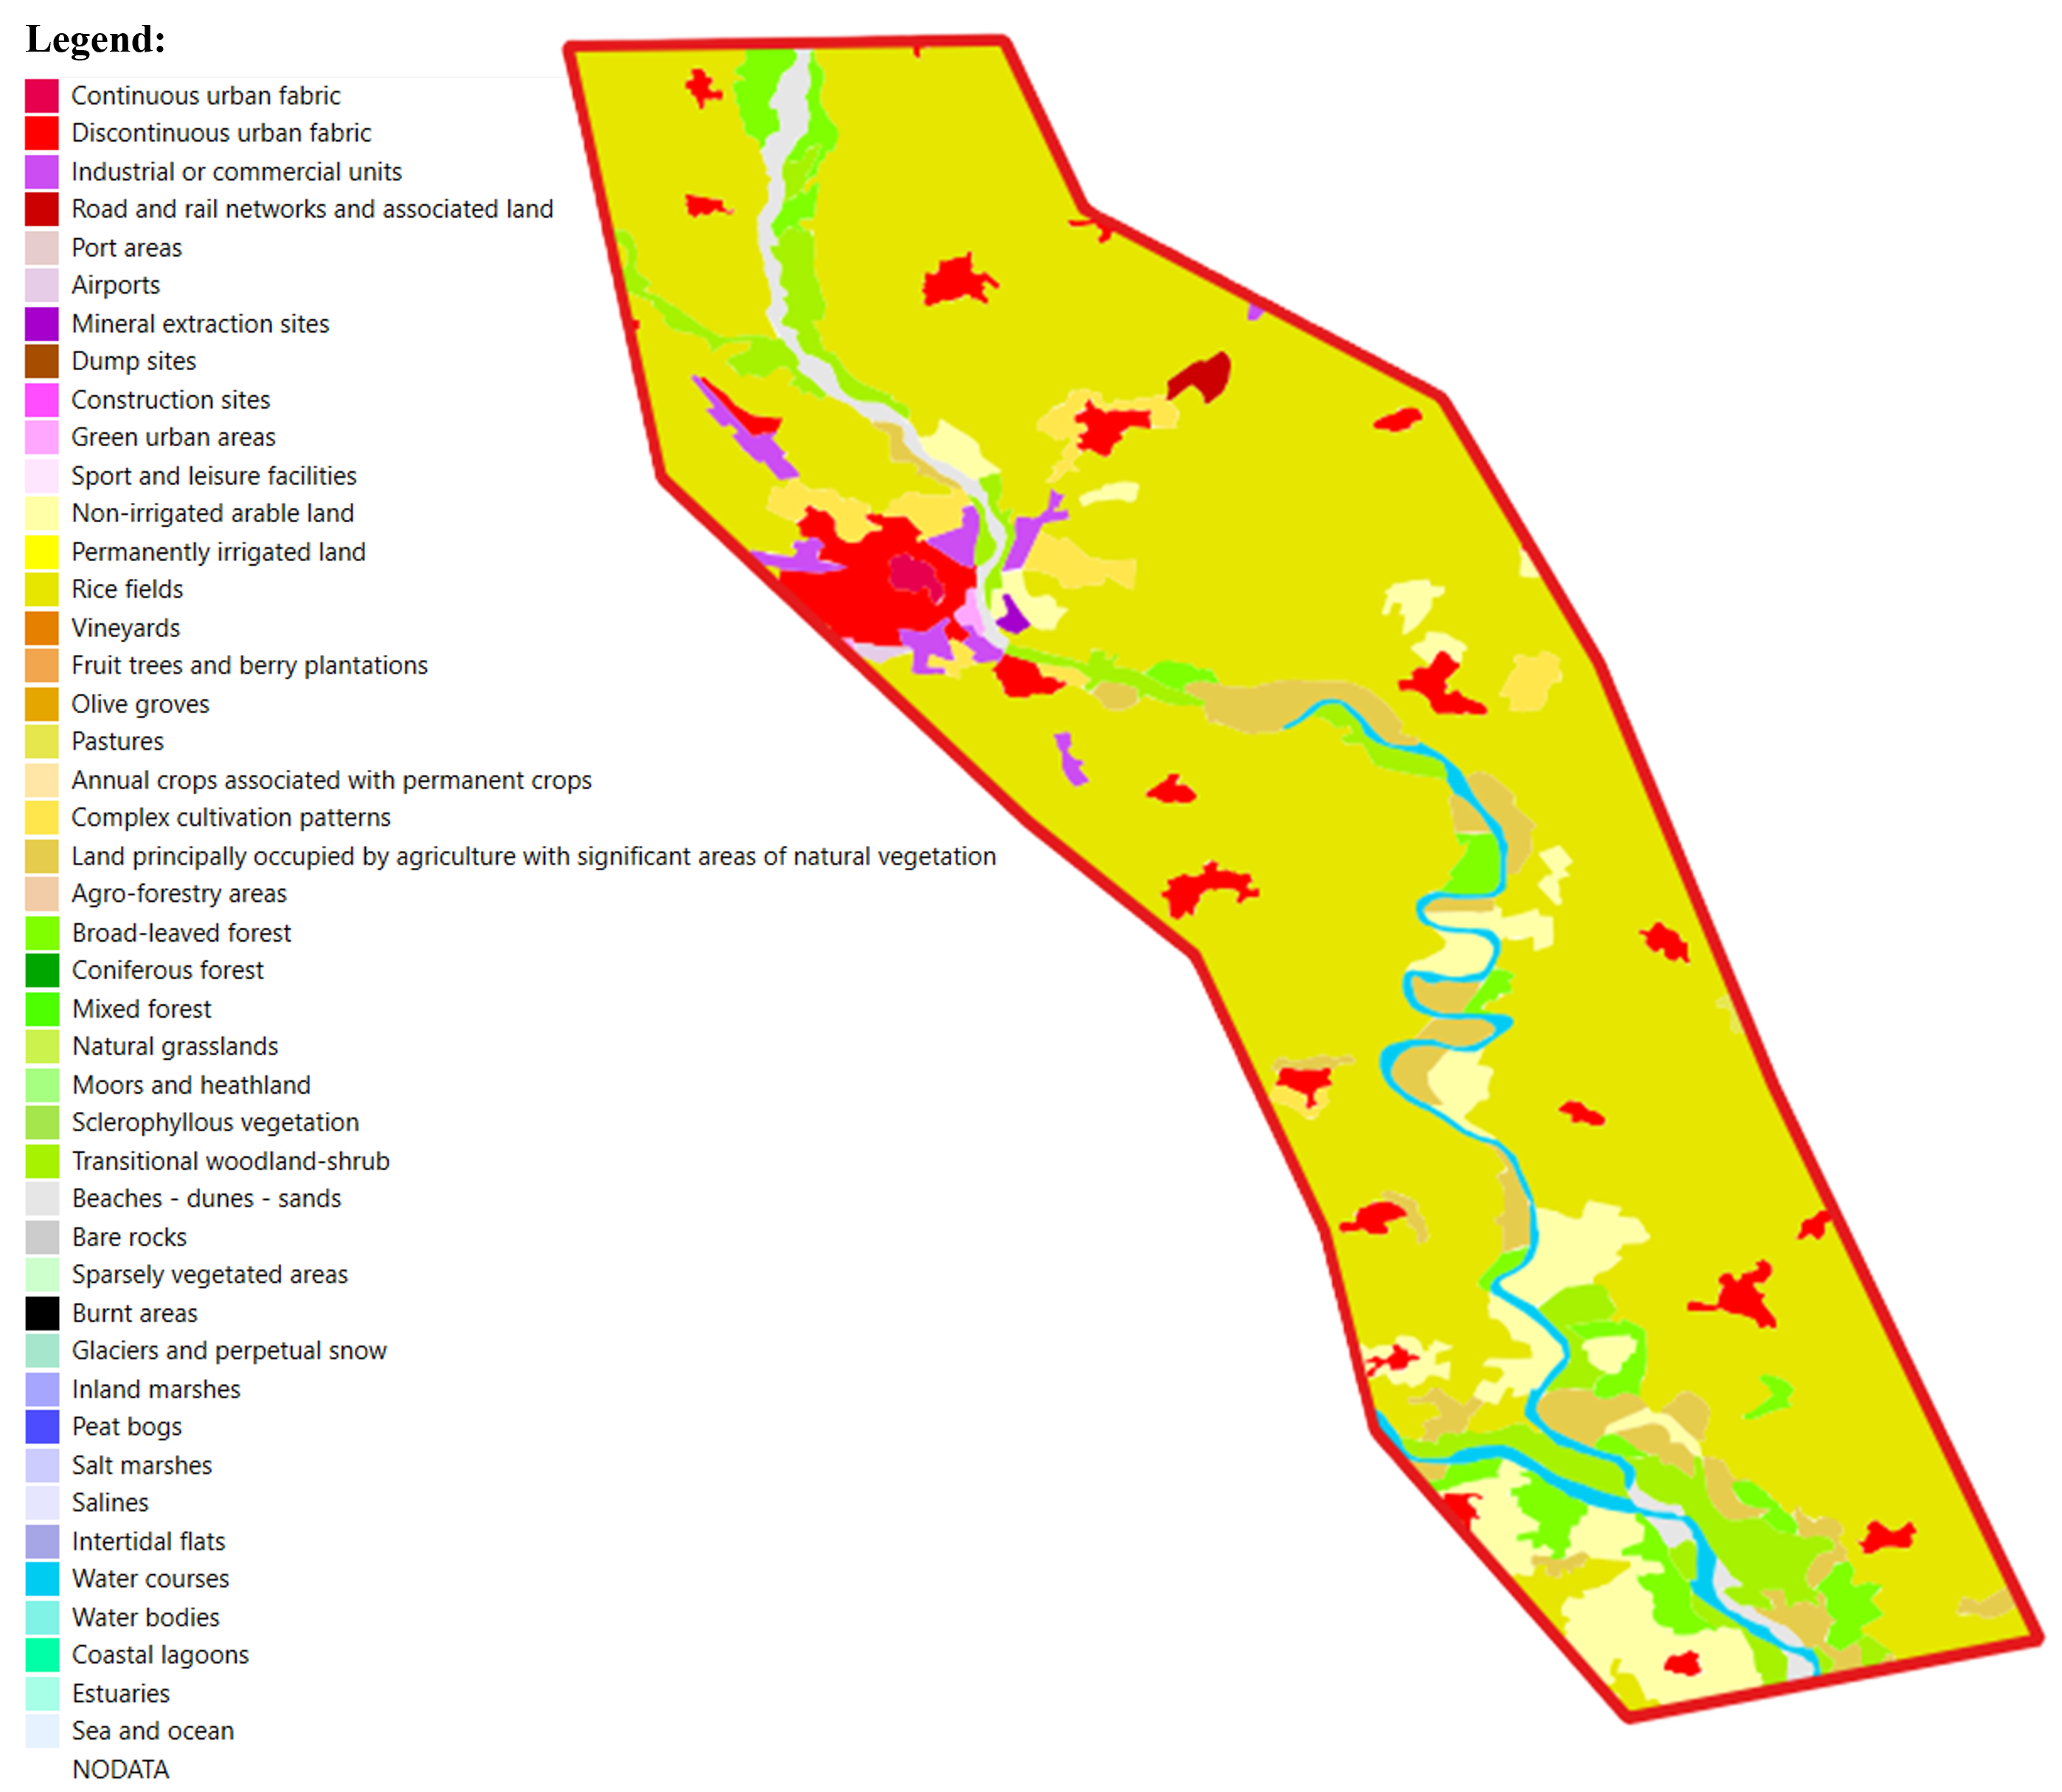
Fig. 3.1.1 – CLC thematic classes
In order to have insights into the land cover classes which are most affected by the flooding event, we have to activate both imported layers. It is possible to notice that the observed event layer overlaps with the land cover one. On further inspection, it seems that overlapping mostly occurs across the area with the most common land cover thematic class, but which is this class? To answer this question in a simple way, we can use the Identify Features tool (Fig. 3.1.2) . Click on the layer you are interested in to identify the features, namely “LC_UTM_Clipped” (1). Click on the Identify Features tool in the toolbar (2), then click on any point in the area with the most common land cover (Color Hex: #e6e600 / RGB: 230-230-0) (3): we will see that our selection is highlighted in red. Now we can read the Band 1 value field in the Identify Results menu (4). The obtained value is equal to 14 which corresponds to the Rice field class. You can verify it by opening the style of the layer.
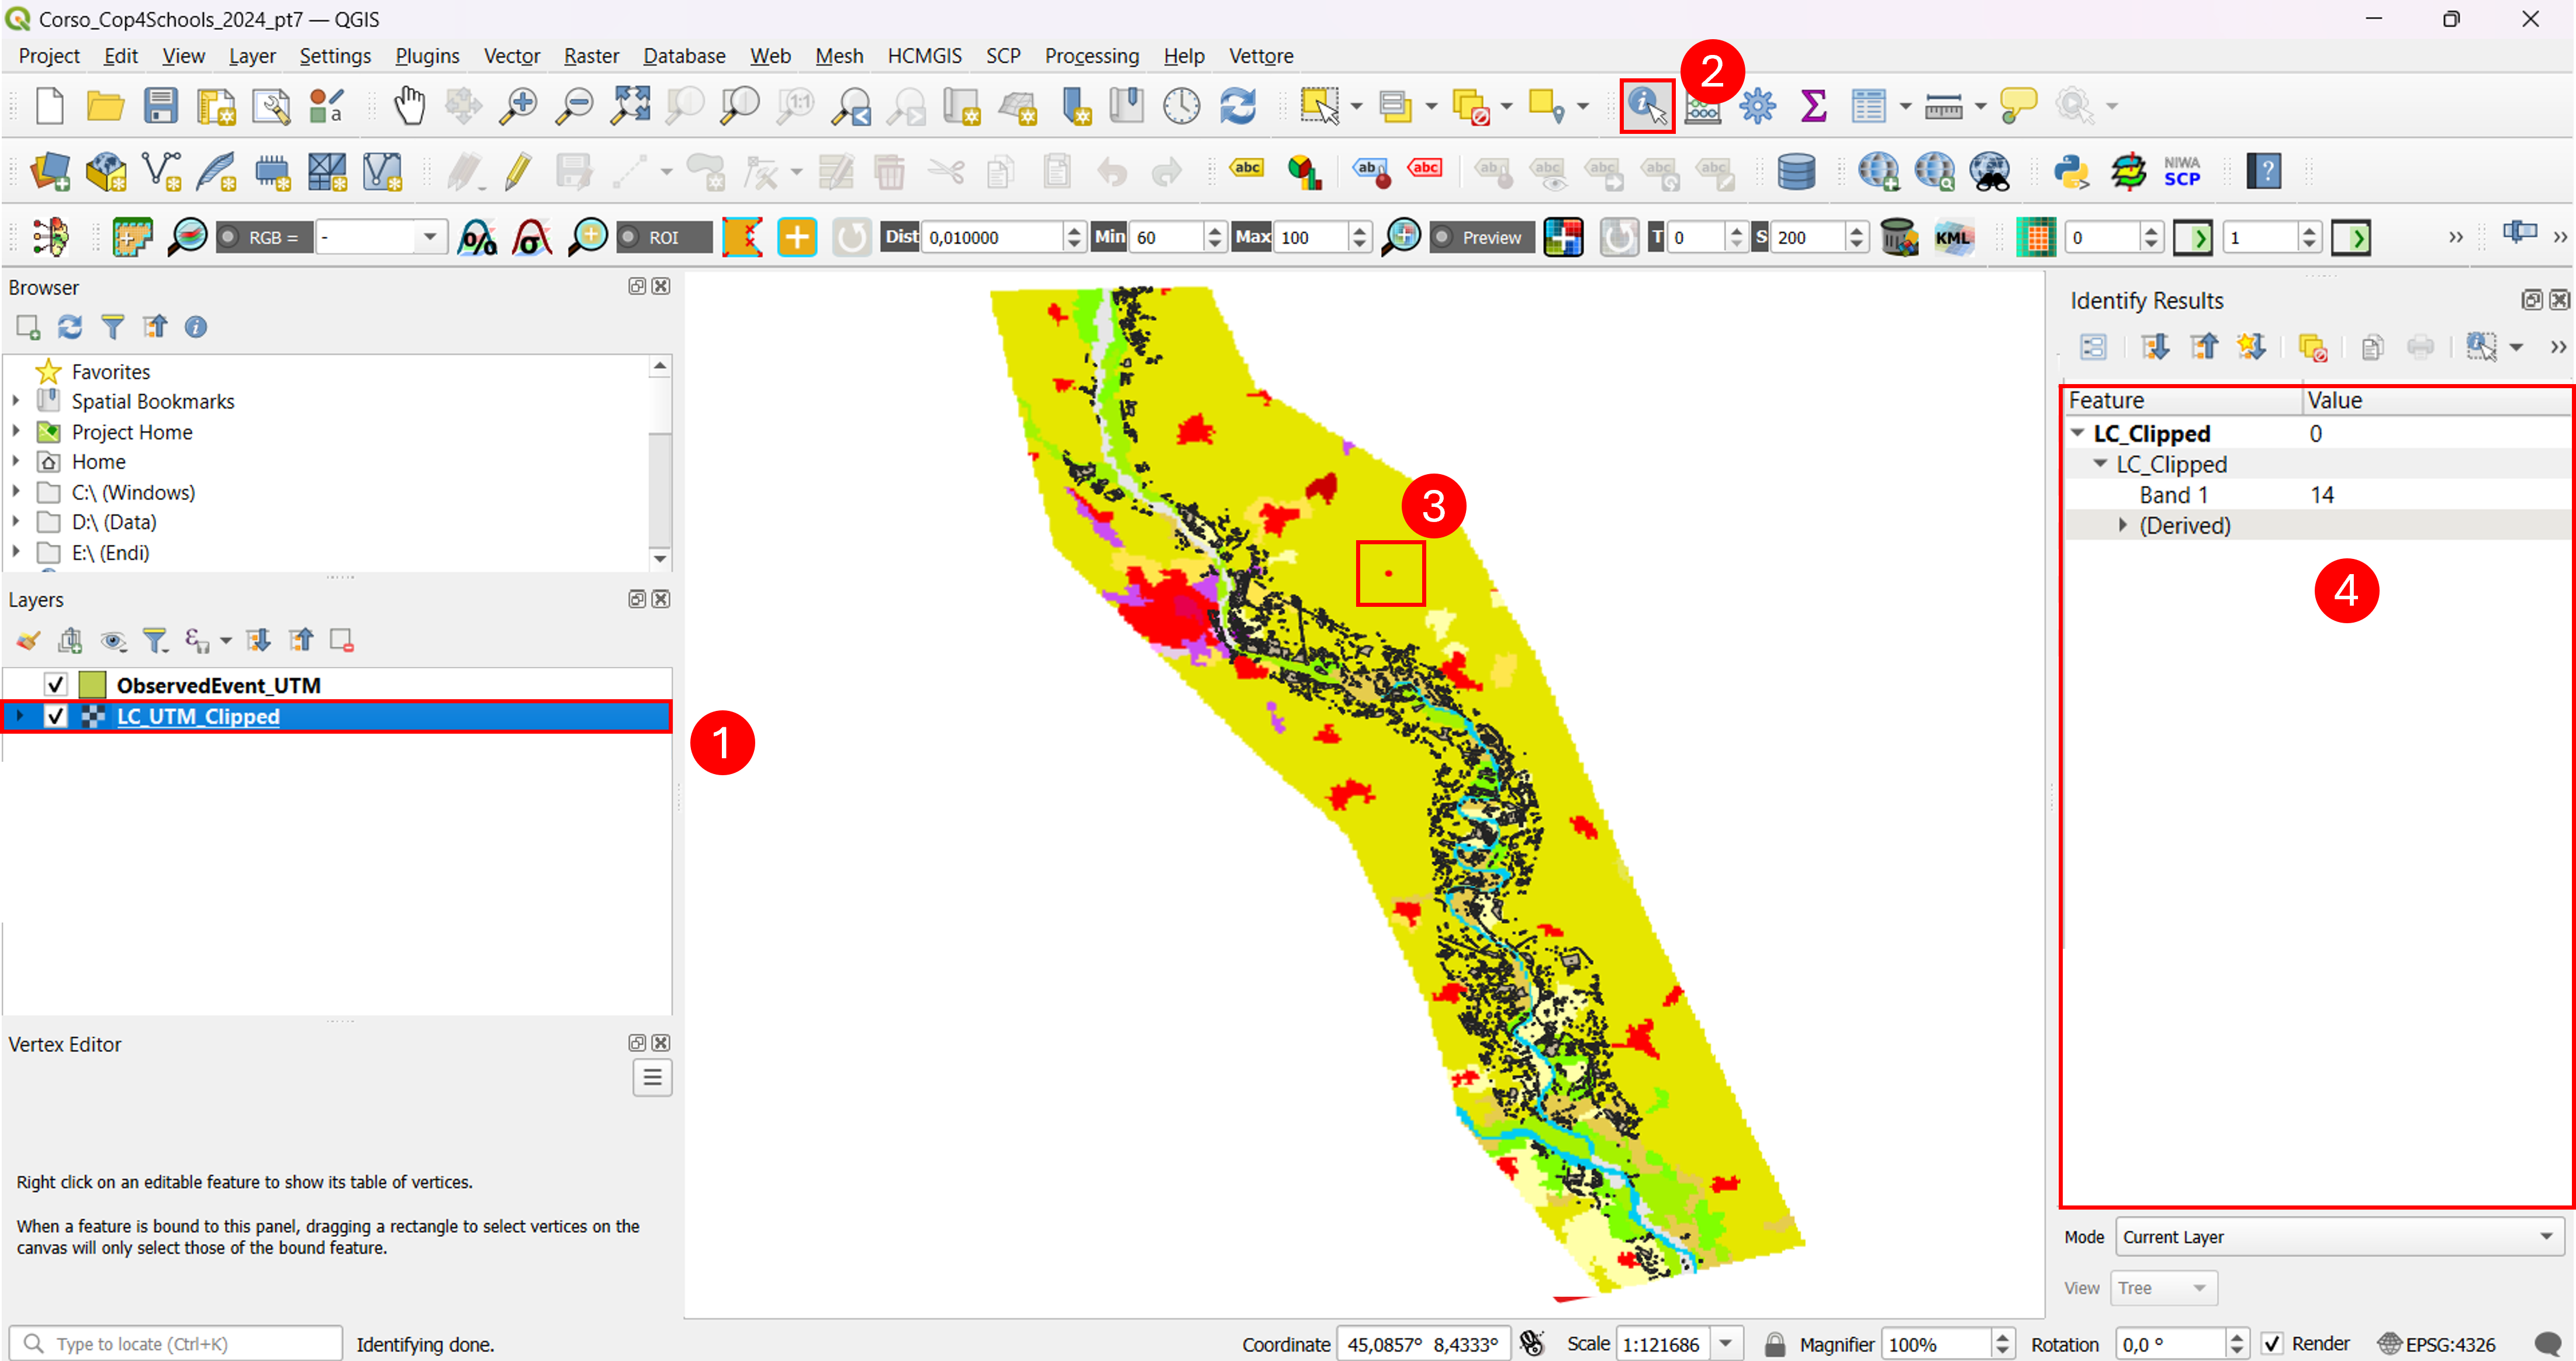
Fig. 3.1.2 – identify tool in QGIS