4.2. Number of People affected by flooding
The model we are going to use is reported in Fig. 4.2.1 .
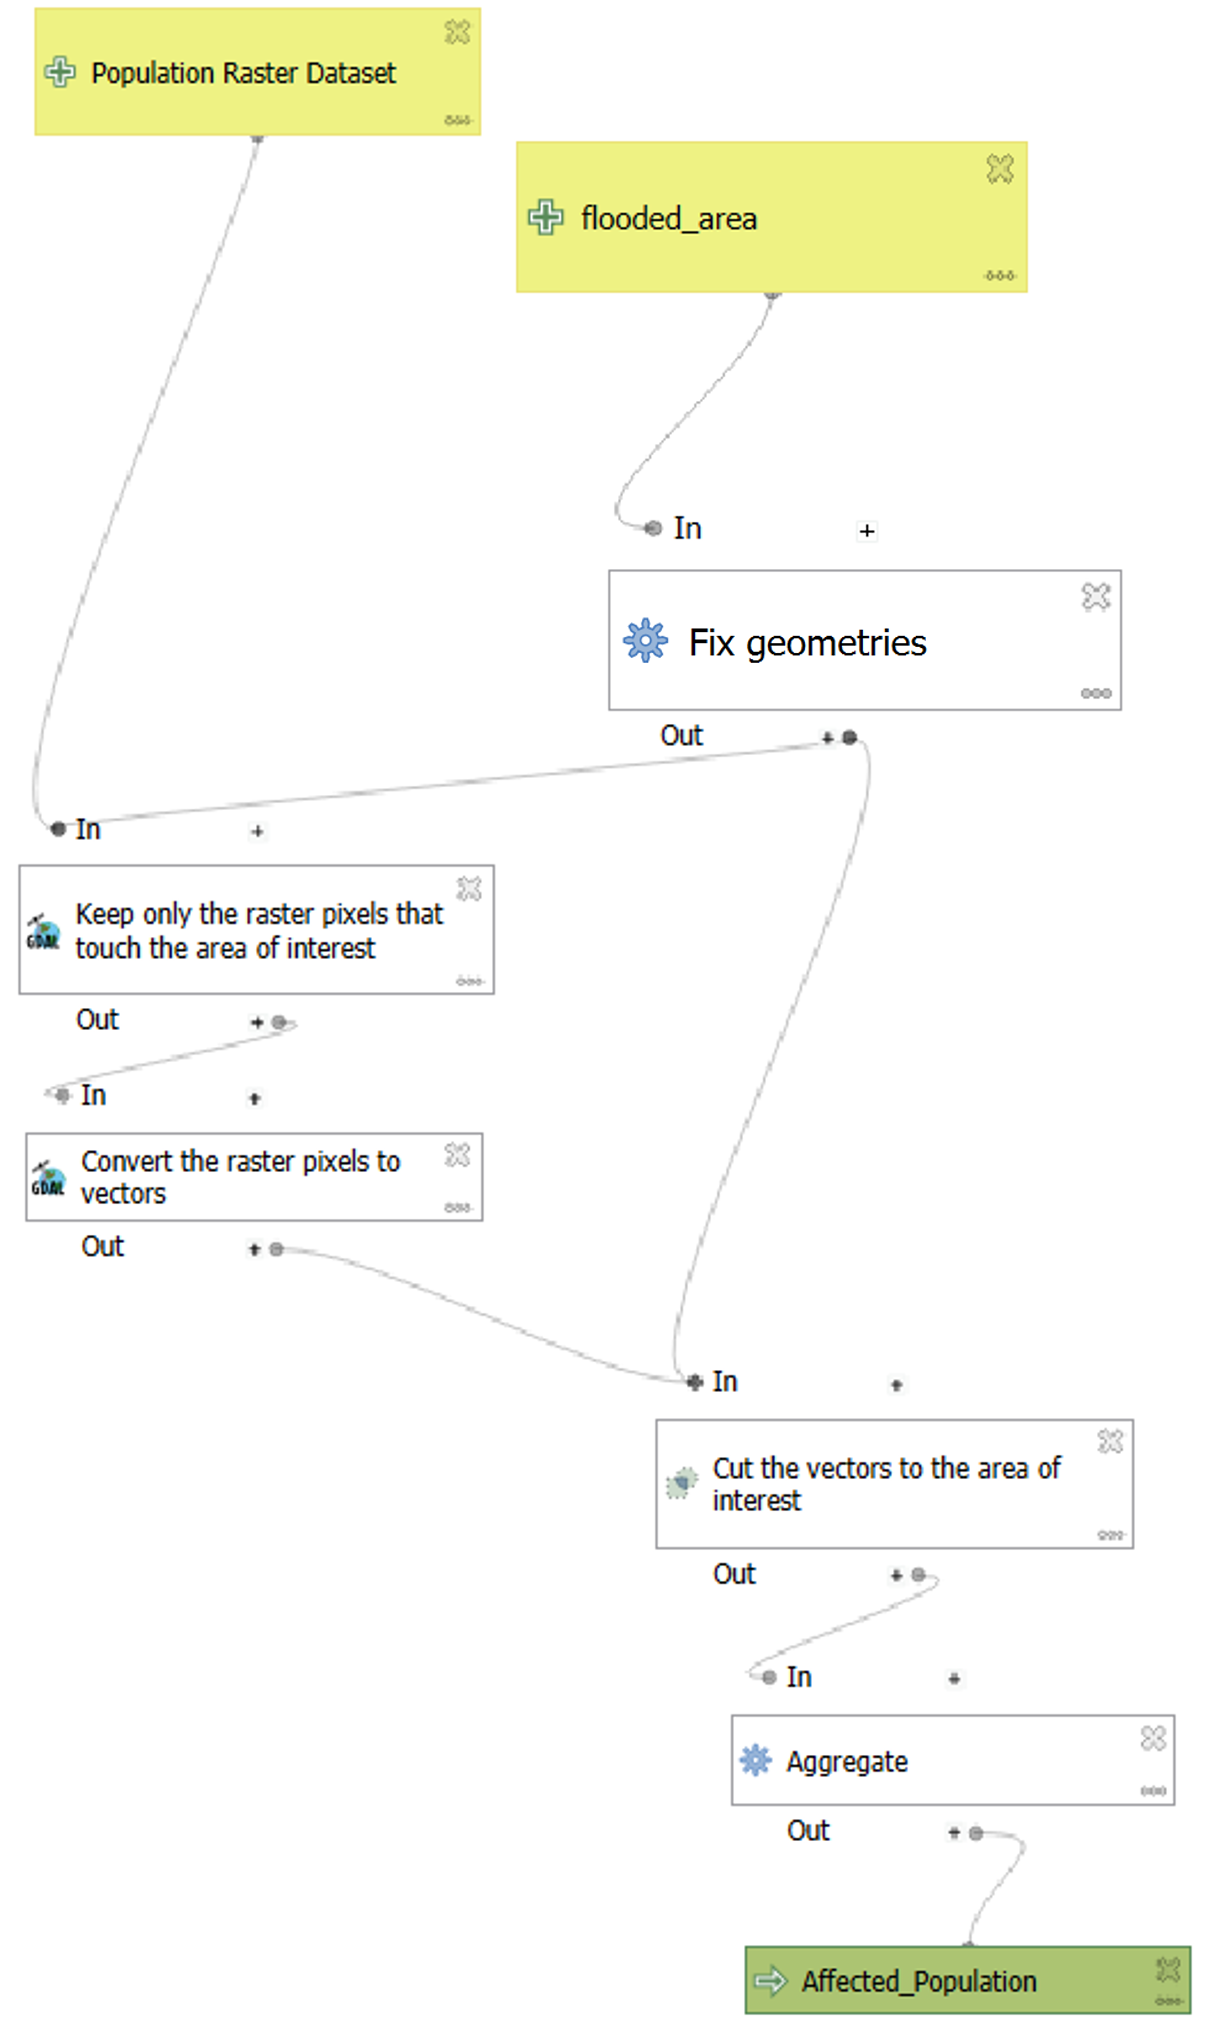
Fig. 4.2.1 – Model Designer - final model
The first step when building a model is to set the input layers (Fig. 4.2.2) . In this case we will use the Population Raster Dataset (“Pop_UTM_Clipped”) (1) and the layer with the flooded area (“ObservedEvent_UTM”) (2). Both inputs have been set as Mandatory.
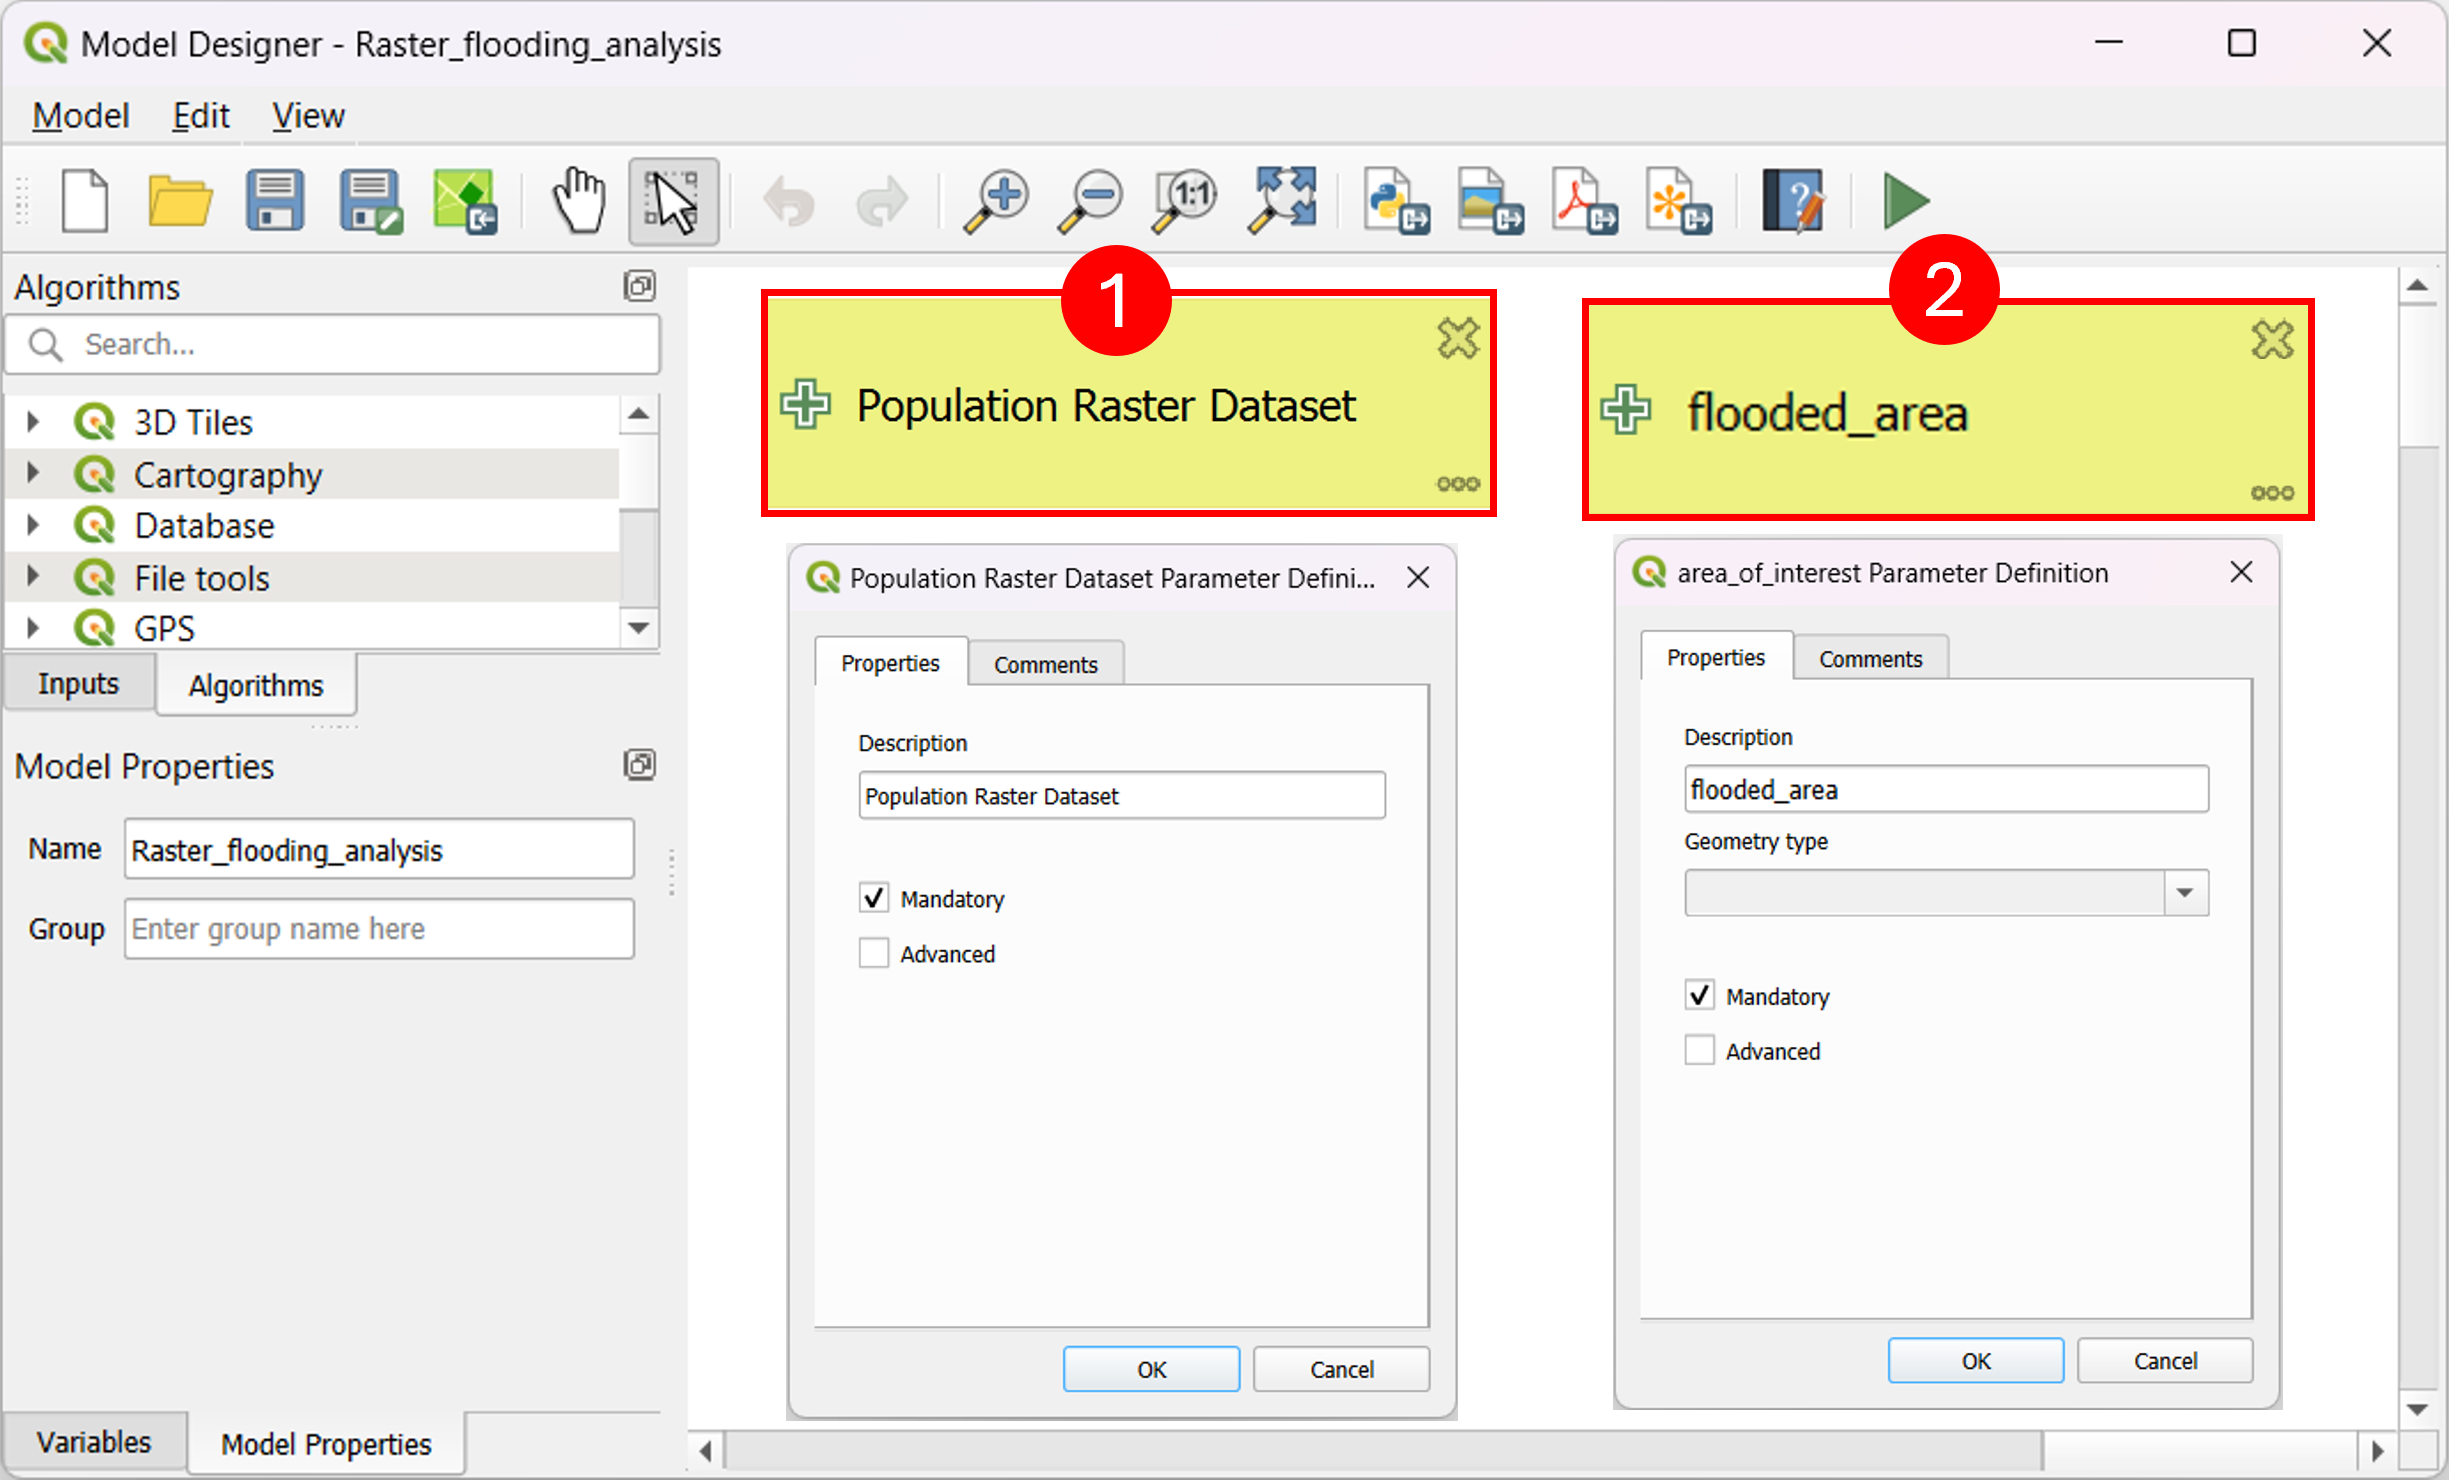
Fig. 4.2.2 – Model Designer - input layers
The next step (Fig. 4.2.3) involves the geometry fix algorithm. You can notice that the Input of this block is connected to the flooded area layer, this will tell that the geometry fix is applied over that layer. The geometry fix algorithm (1) is used to repair issues or errors that can emerge when working with vector data, especially when conversion or digitalizations procedures are applied.
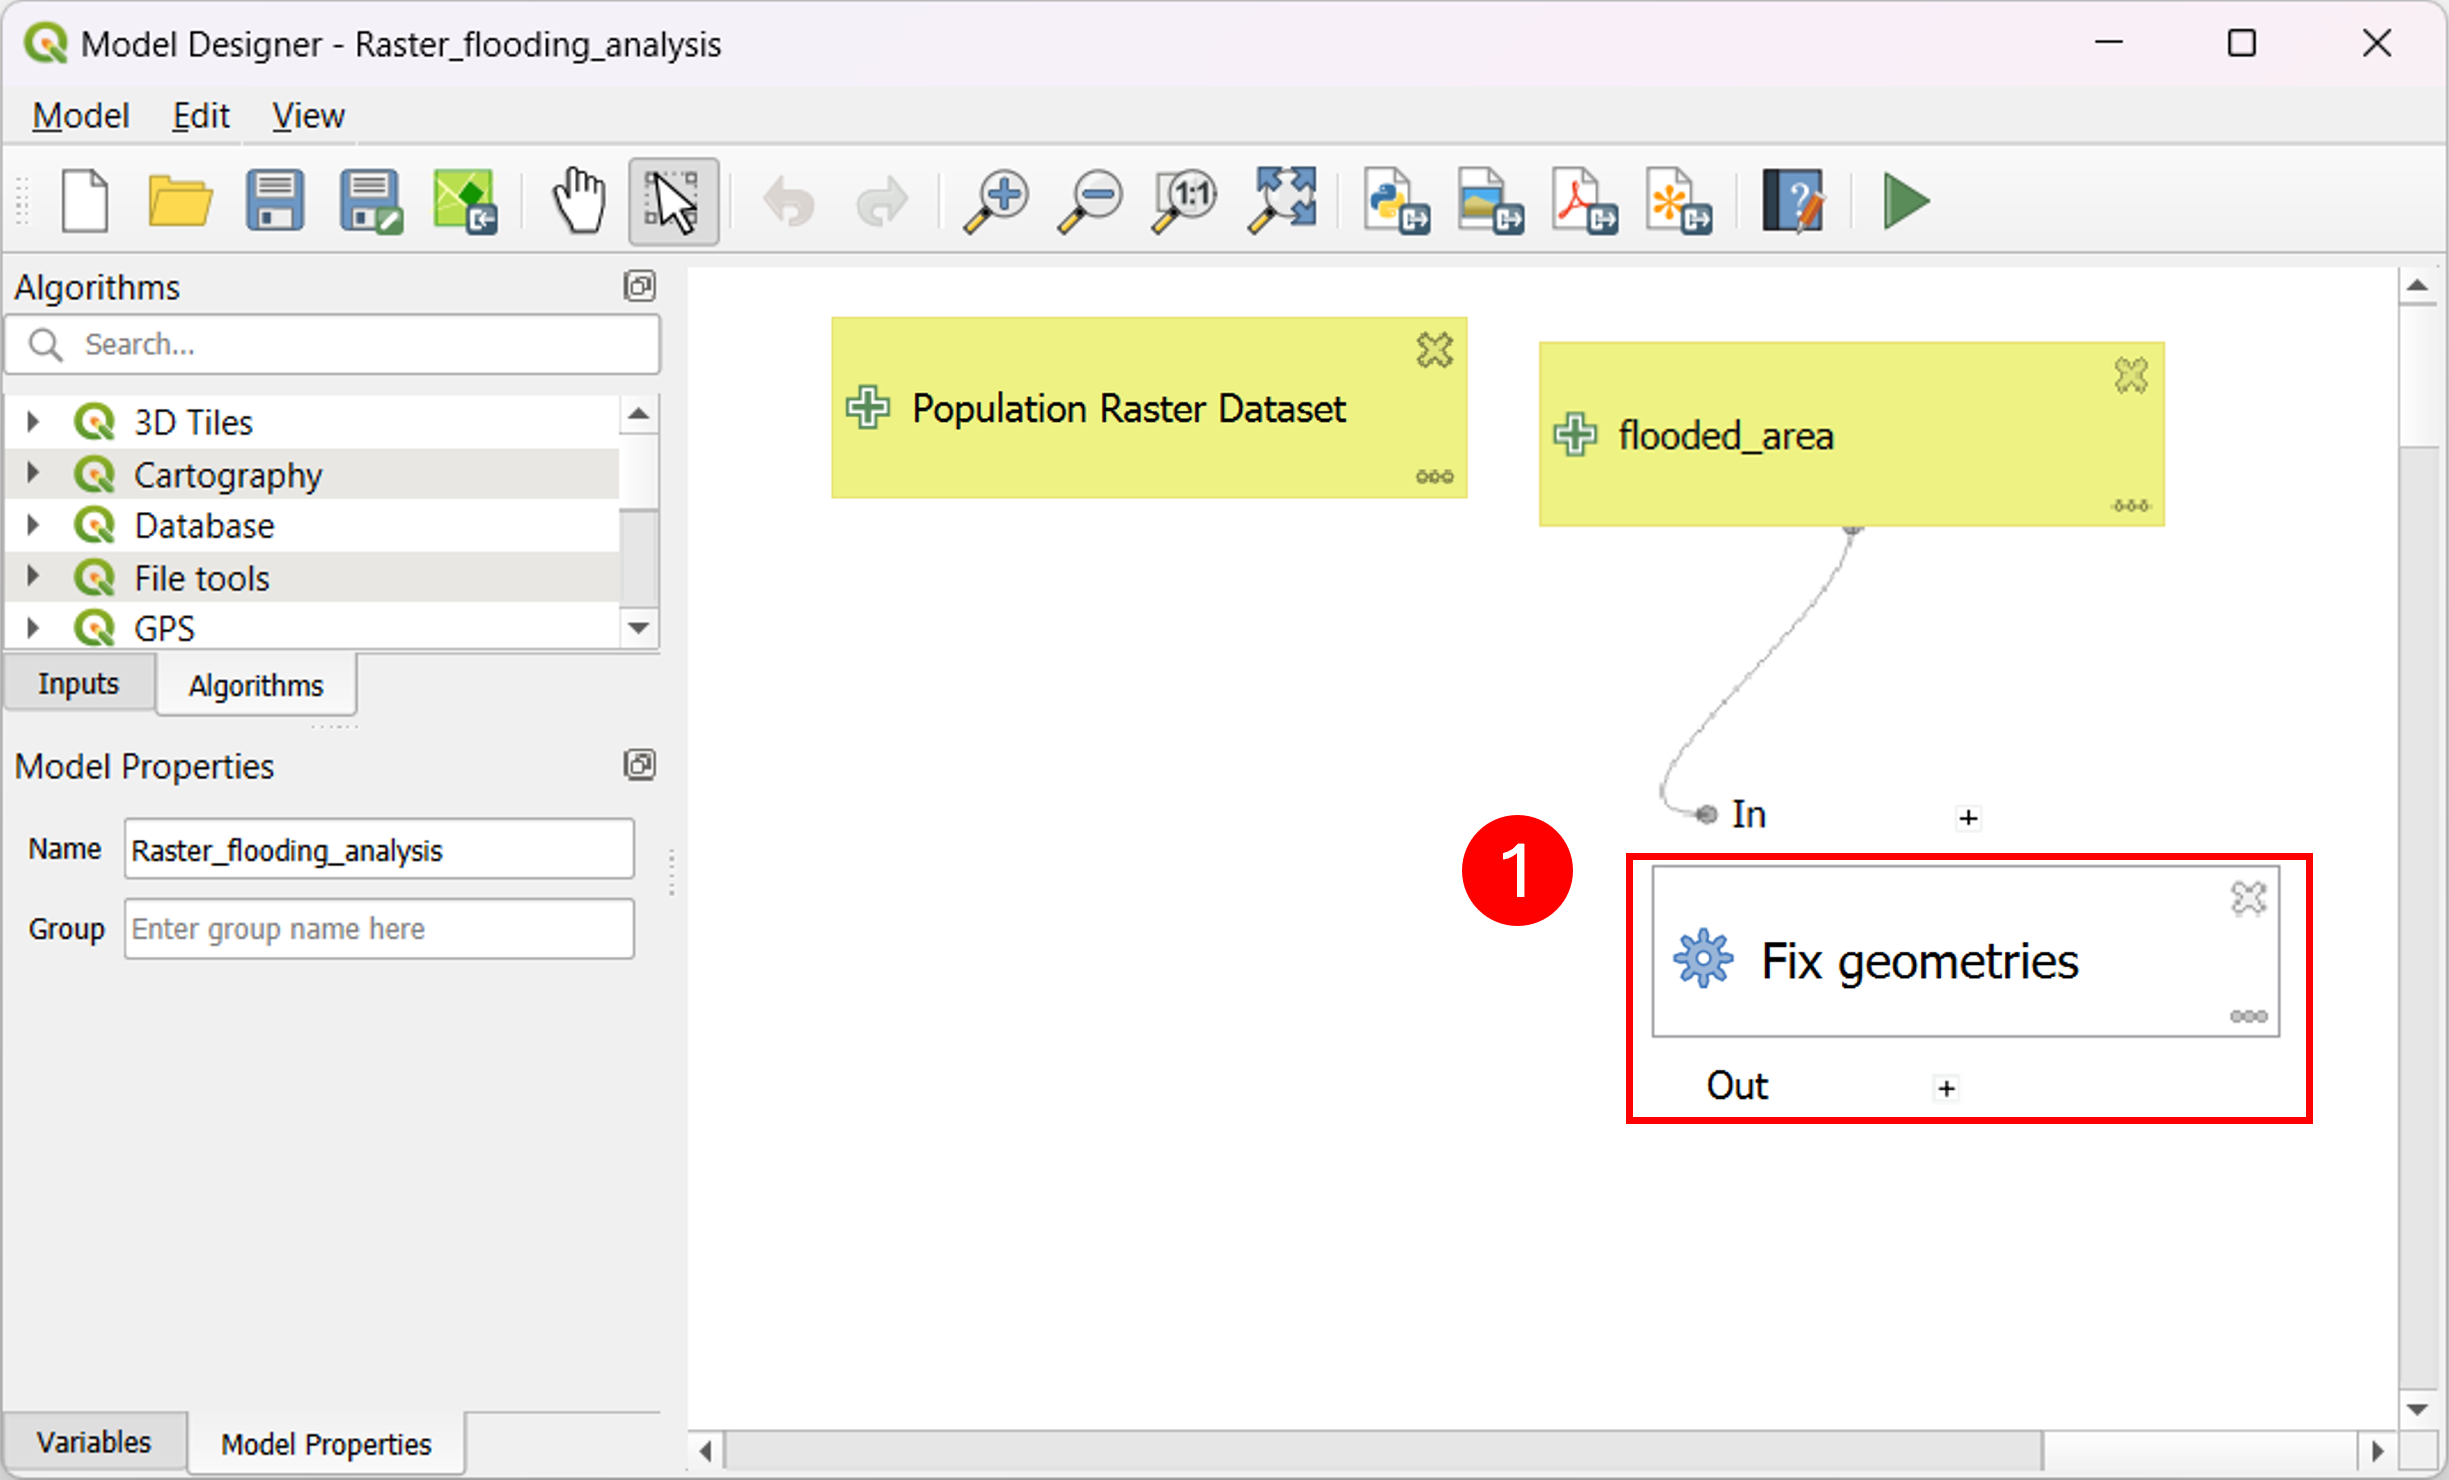
Fig. 4.2.3 – Model Designer - geometry fix
The next step is depicted in (Fig. 4.2.4). At first we will use the Clip raster by mask layer tool (1) in order to reduce the computational burden of the following operations. As you can see the input of this block is composed of the Corine Land Cover layer, which is the layer we are going to clip, and the flooded area layer with fixed geometries. As a second step we will convert the obtained raster layer to a vector format (2), with this procedure each cell of the raster will become a polygon. In this procedure we add a column to maintain the information (the number of people in that cell) regarding that cell.
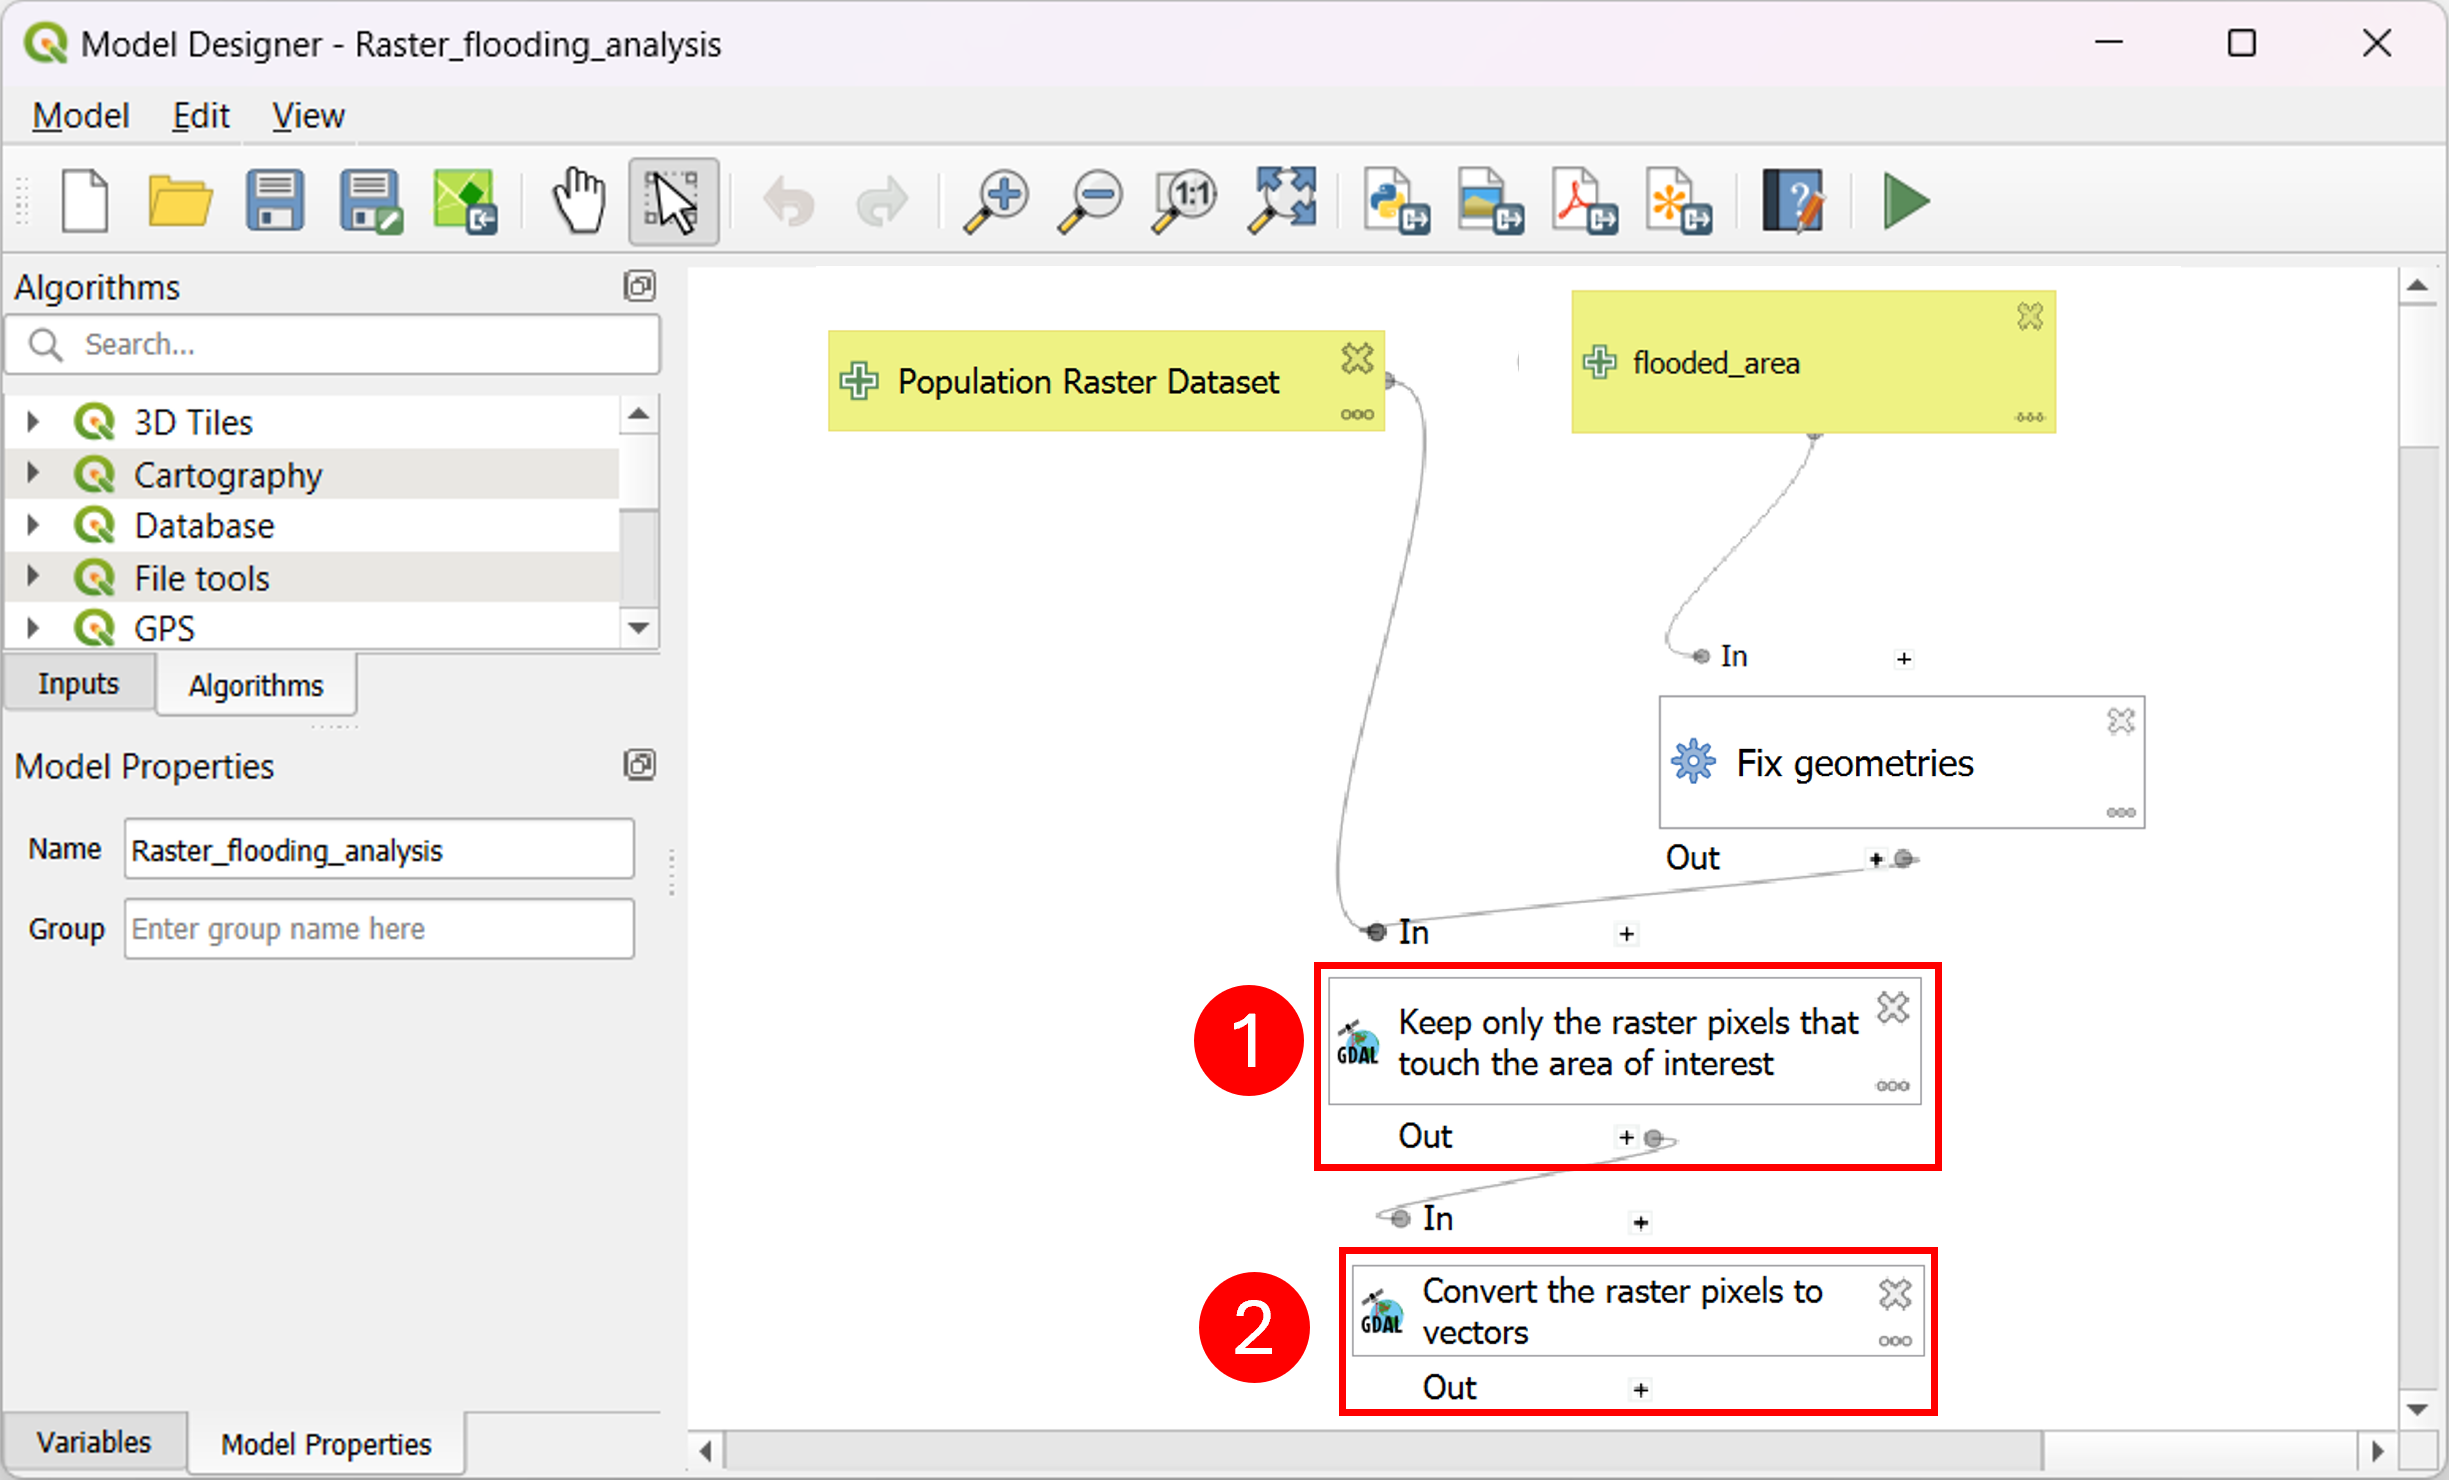
Fig. 4.2.4 – Model Designer - clip and polygonize
In (Fig. 4.2.5) , the next step is shown. This step involves cutting the Population layer converted to vector over the flooded area (1).
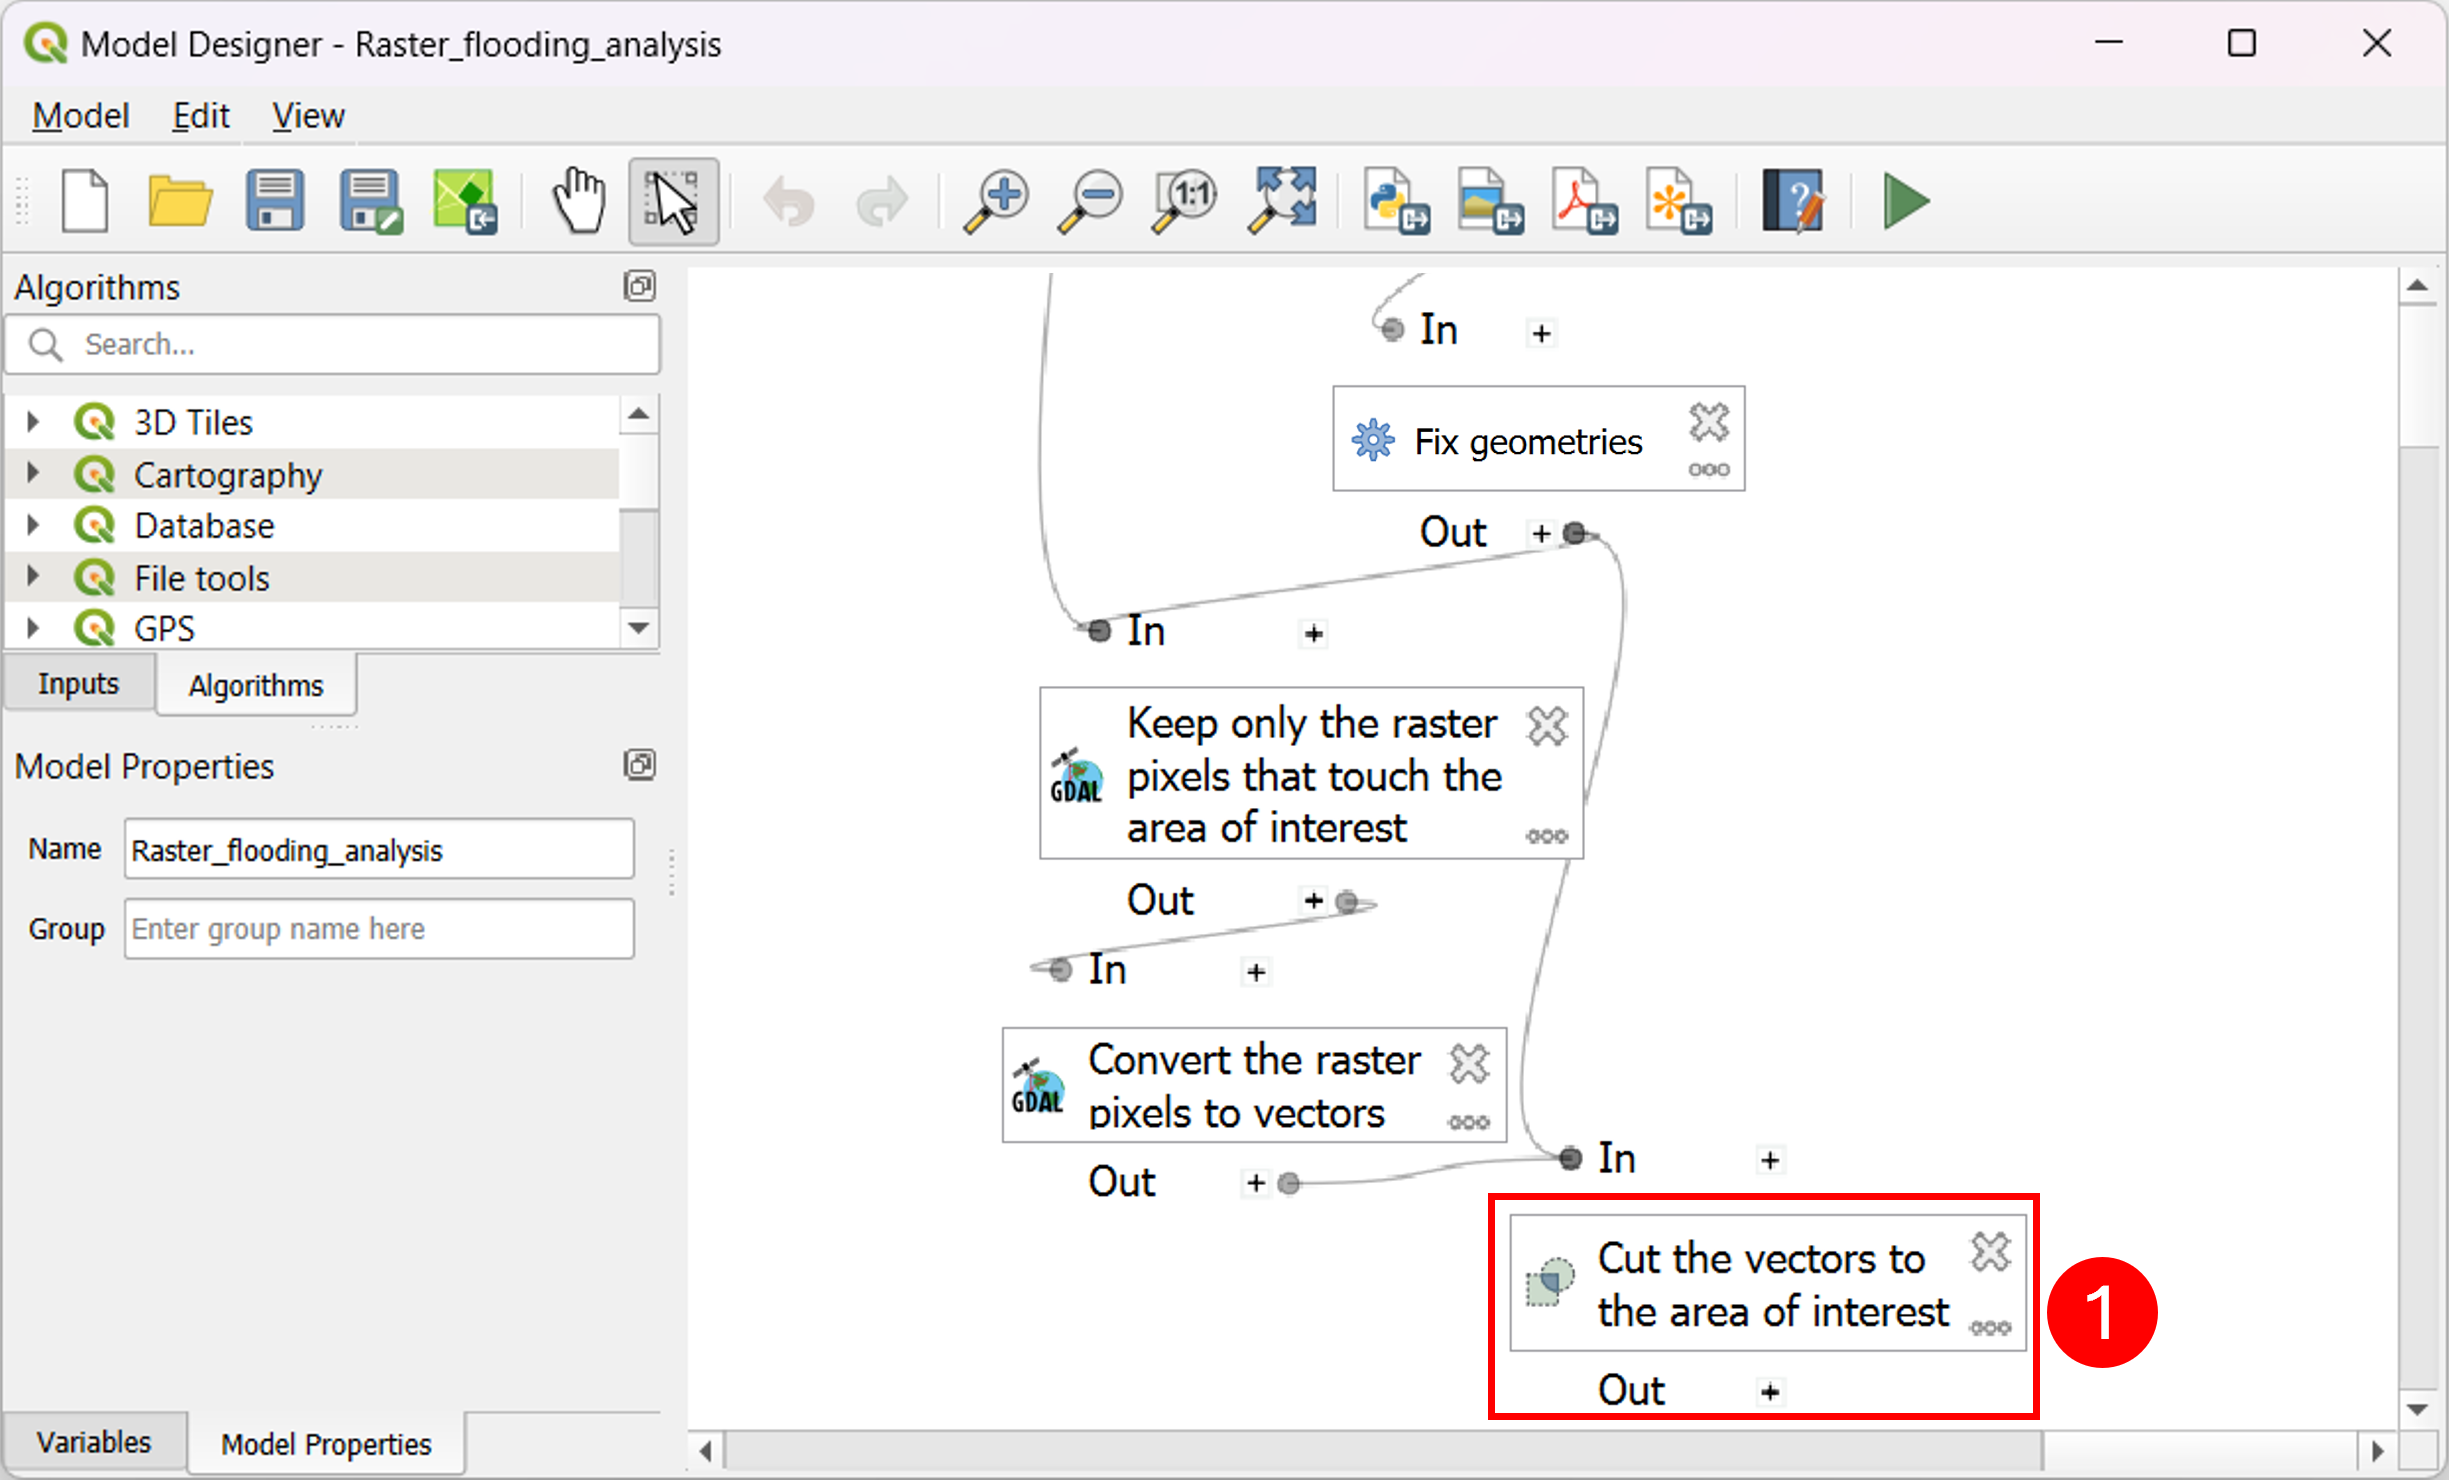
Fig. 4.2.5 – Model Designer - clip
The last step is depicted in (Fig. 4.2.6) and involves the Aggregate algorithm (1). This algorithm combines features based on a spatial relationship or another attribute, in this particular case we use the aggregate algorithm to aggregate all features since the input of this block is composed of a vector layer with only the number of population features. Finally, the output of the model is the “Affected_Population” layer.
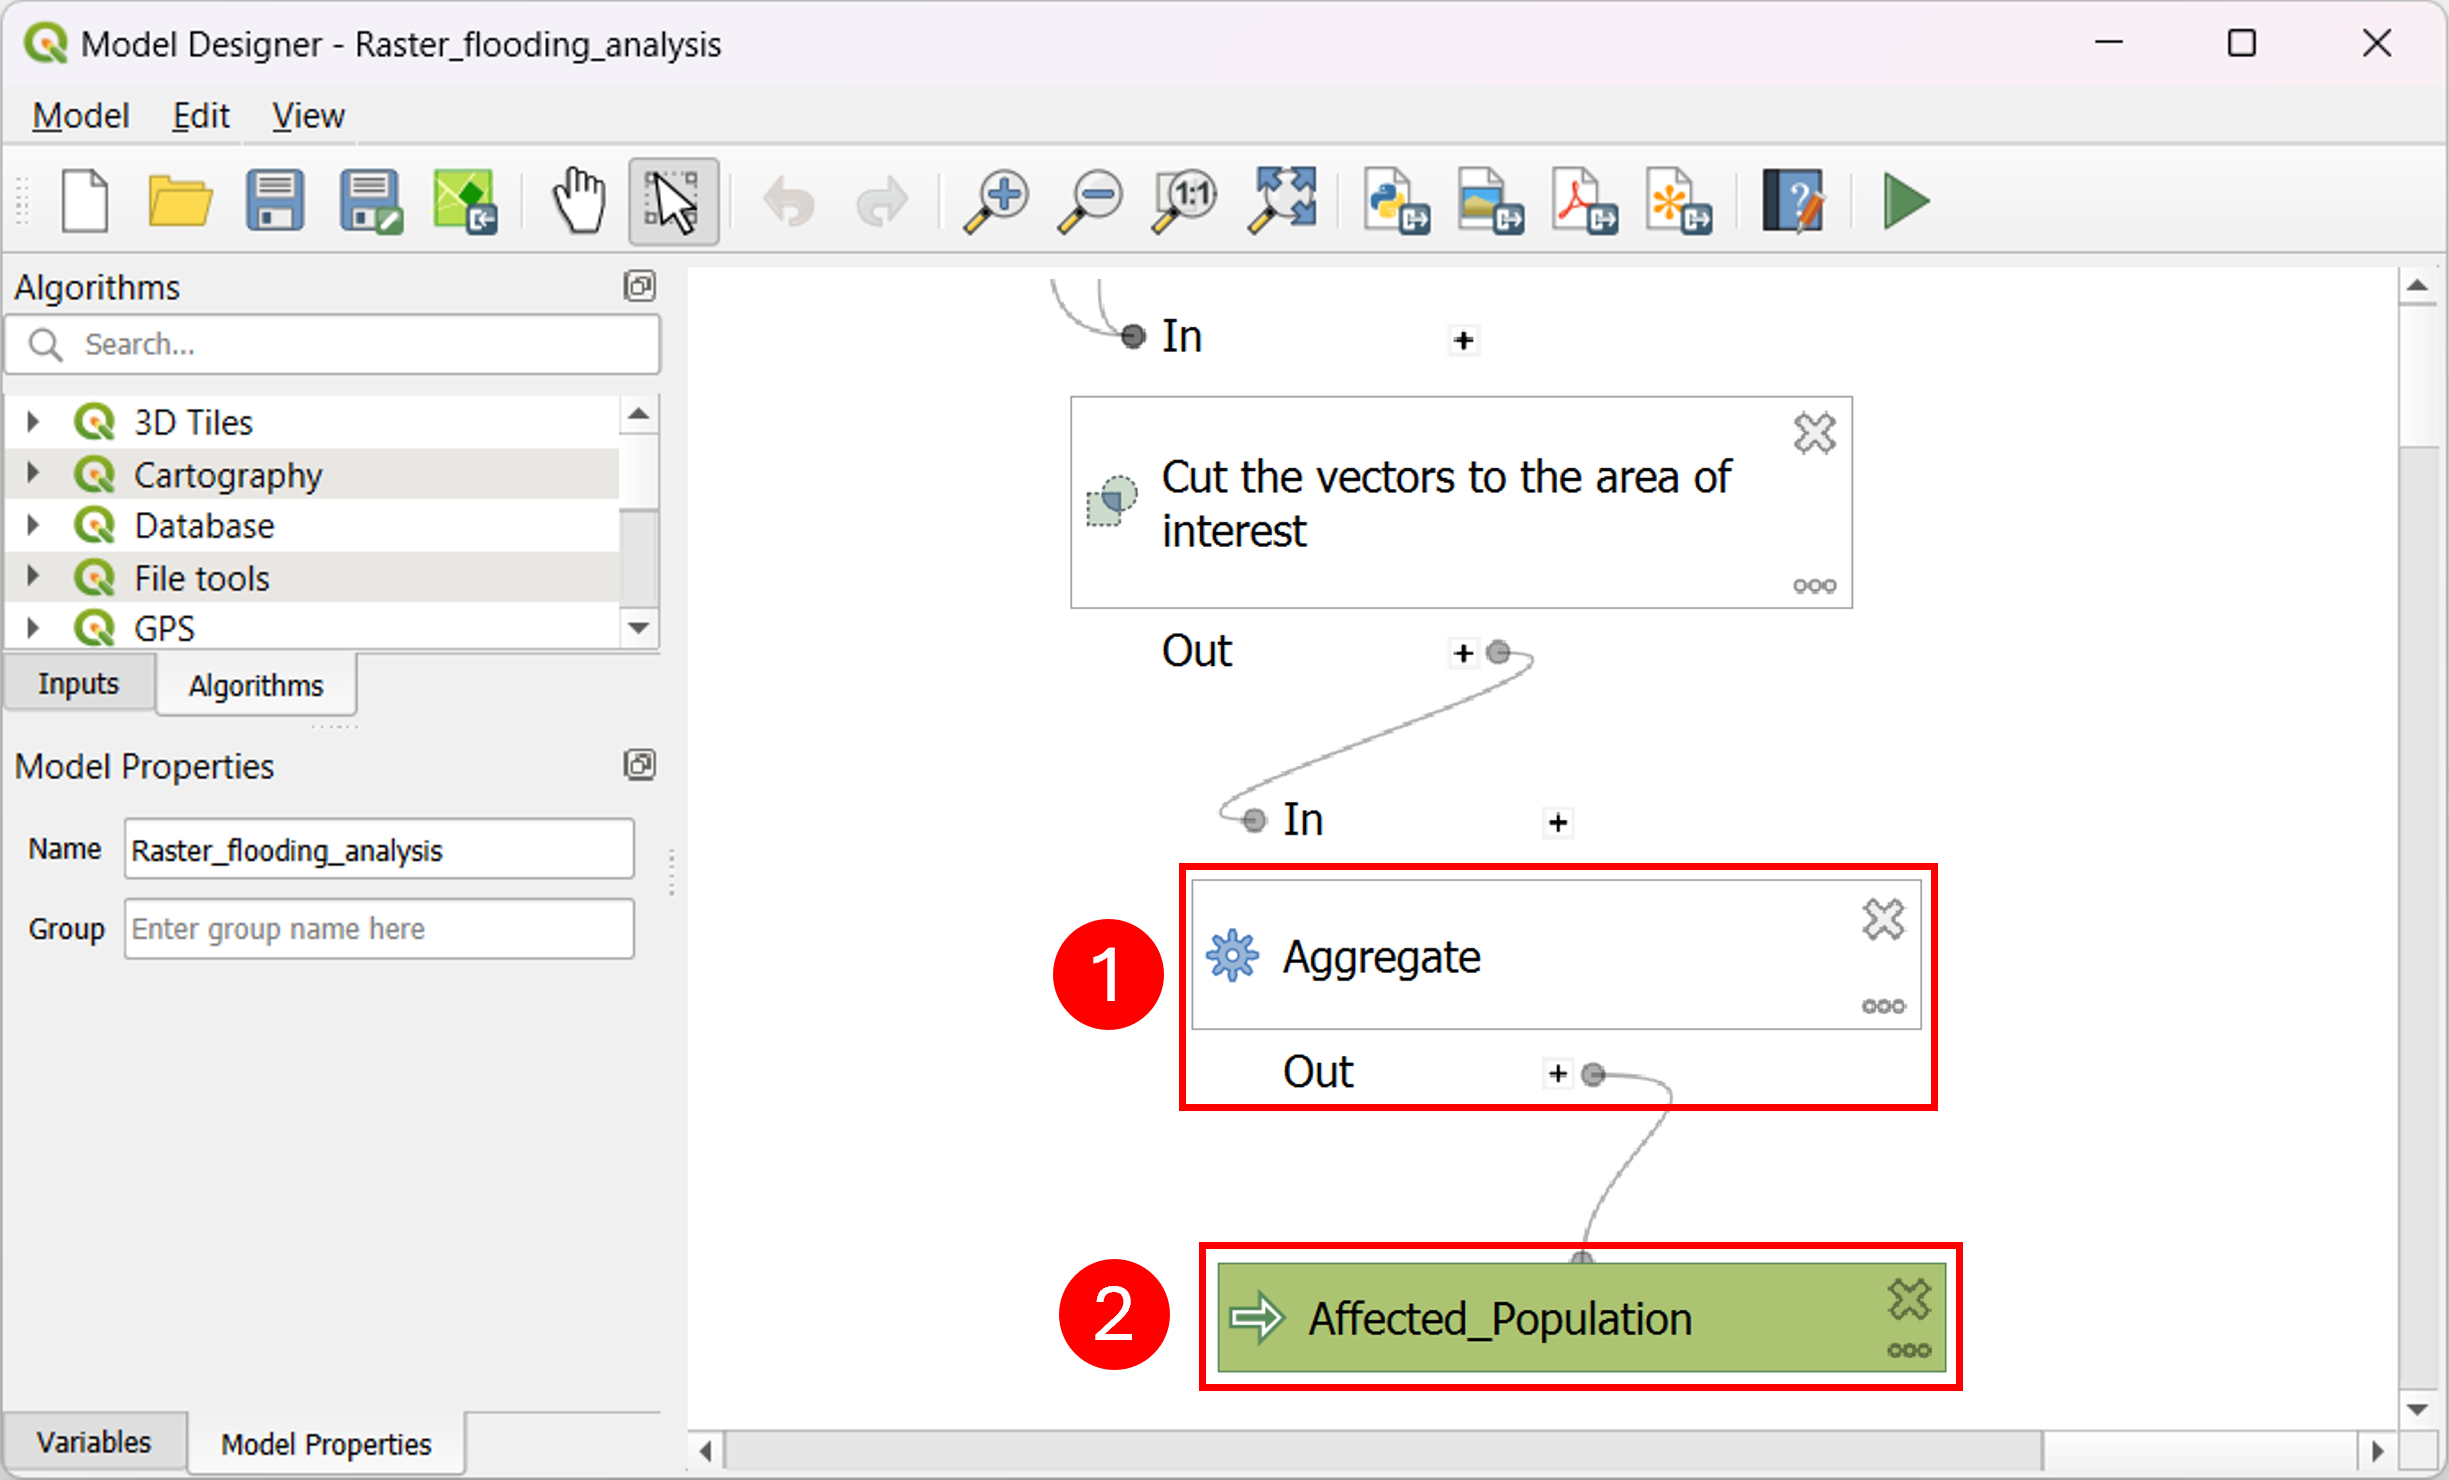
Fig. 4.2.6 – Model Designer - aggregate and population computation
Click on the green player button to run the algorithm (1) (Fig. 4.2.7) . You will be asked to choose the layer that will represent the input to the model. Set the flooded_area field as “ObservedEvent_UTM” (2) and the Population Raster Dataset field as “Pop_UTM_Clipped” (3). Once done, click on Run (4).
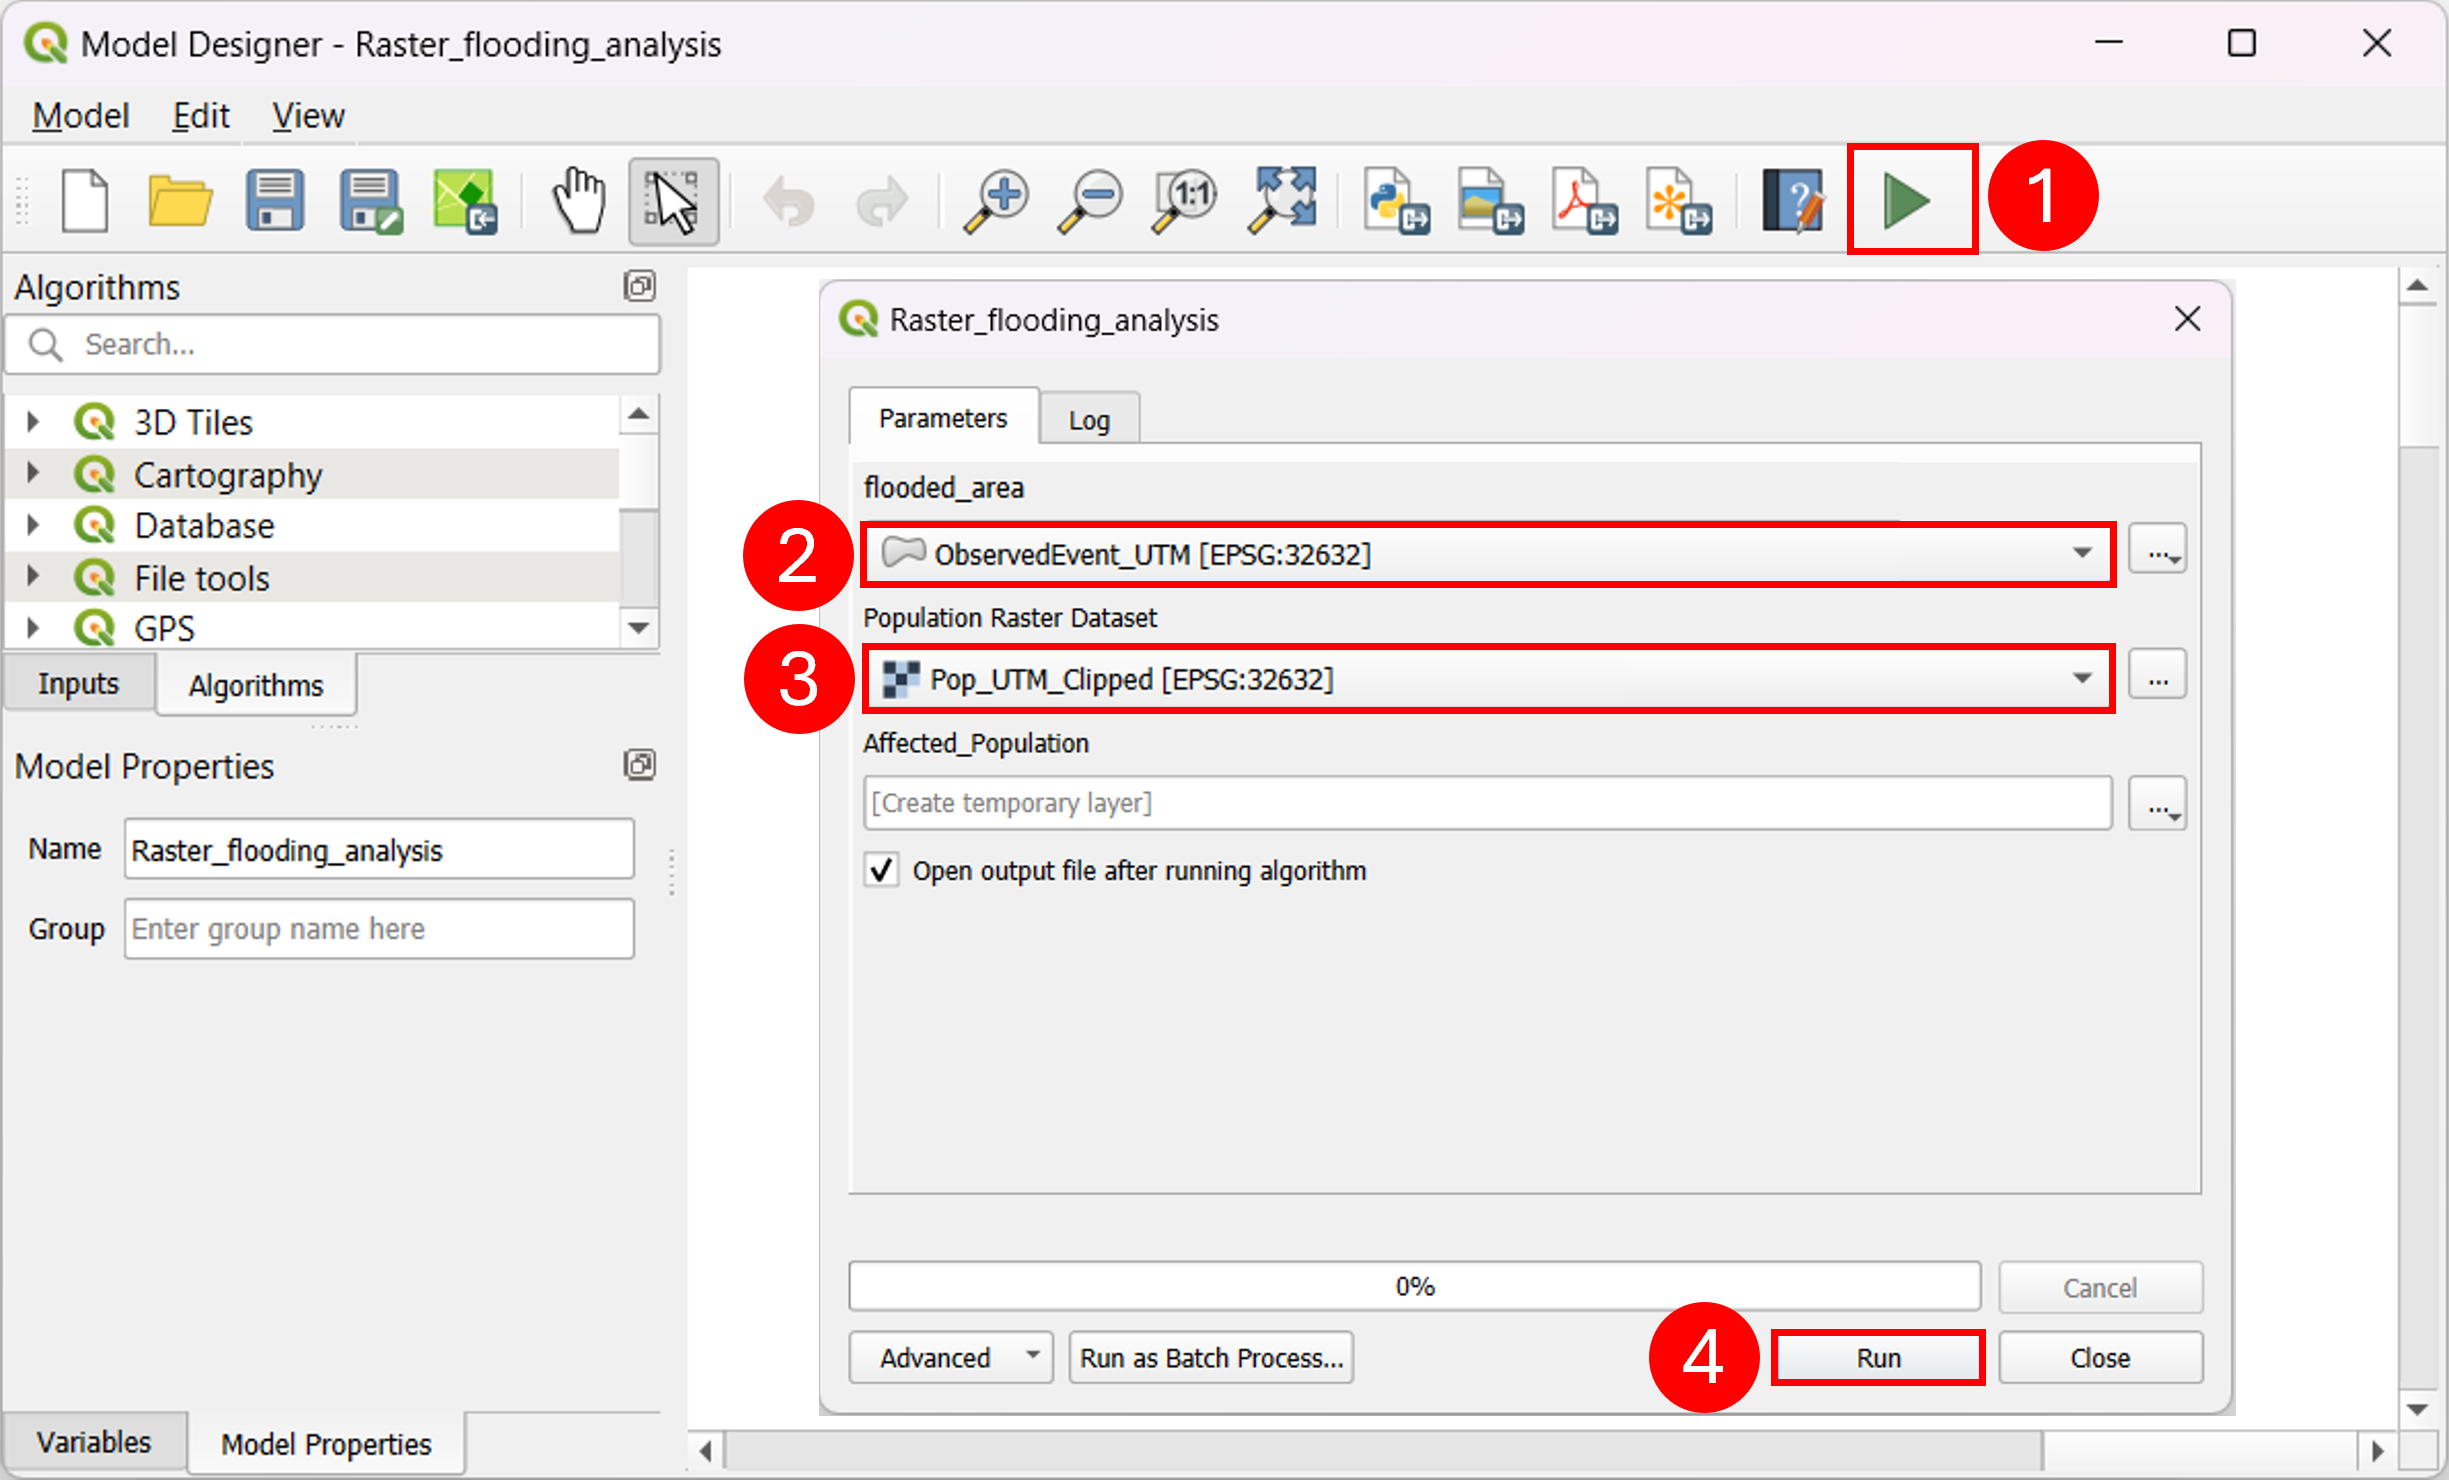
Fig. 4.2.7 – Model Designer - Run Model